Hi,
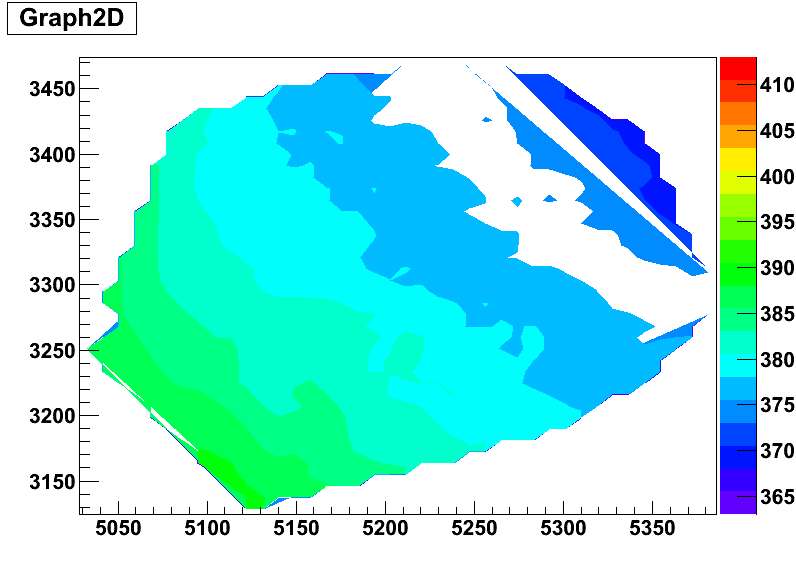
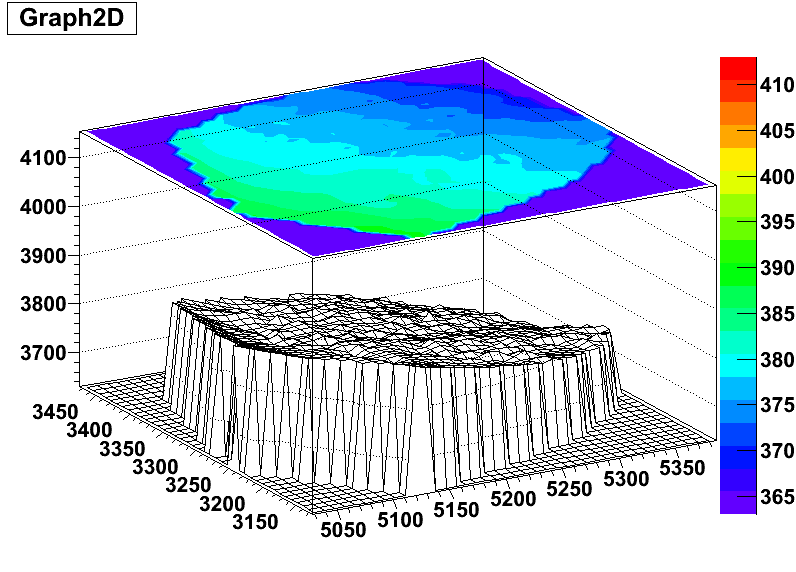
I read one dataset (points with the format: x y z) and plot them in TGraph2D. I use 2 draw options of TGraph2D: surf3 and cont. However, on the plot by ‘cont’, there are some gaps (empty regions) but for the plot by ‘surf3’, it looks okay.
- Anyone can explain the difference?
- How can I get the contour in ‘surf3’ so that I can play with it (compare it with others etc.)
Thanks,
Zhiyi.