Continuous color palette and "colz" display

Hello,

Two questions.

  1. Is there a way to get “colz” to display values different from that filled in the histogram? I’m doing:

for(ii=0;ii<1000001;ii++) {
err = fscanf(feff1,"%d %e %e %e %e",&L,&x,&y,&R,&p);
if(err<0) break;
phimin = -0.001pmax1;
phimax = 0.20
pmax1;
wt = (p-phimin)/(phimax-phimin);
if(wt<0.0){
wt = 0.0;
}
if(wt>1.0){
wt = 1.0;
}
col = 1.0-exp(-5.0*wt);
renR1->Fill(x,y,R);
renp1->Fill(x,y,col);
}

and I want the color bar to show the values of p that correspond to the colors but want to display col when I draw the histogram.

  1. Is there a way to get a continuous color palette? I’m trying to replicate the attach plot made with PGPLOT with root.

Thanks in advance.

Best,

Joe Bernstein


No. When you plot an histogram using the option COL (or COLZ) the color of each cell is defined by mapping the cell content (Z value) to a color palette.

Yes, do:

gStyle->SetPalette(1);

Hi,
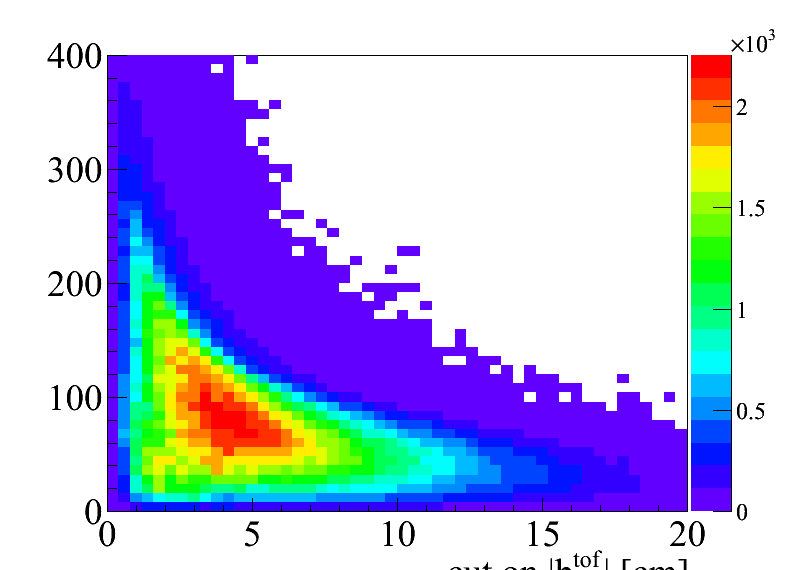
Is it possible to have a smooth palette display on the z-axis while drawing with colz?
gStyle->SetPalette(1) just gives you the nice colors, (or the smoothing doesn’t work for me).
I’ve really been trying to solve this issue but can’t find anything on the web. If anybody knows how to do this it would be great.

Thanks,
Sebastien


See:

root.cern.ch/drupal/content/how- … or-palette

Ok thanks,
h2->SetContour(n) is the key (though it still isn’t completely continuous, but I think it’s simply not possible)

Add more contour.
But that might not help too much.
The main limitation here is the bins’ sizes…