Continuing the discussion from An unwanted horizontal line is drawn at y=0

Continuing the discussion from An unwanted horizontal line is drawn at y=0:

The last post says

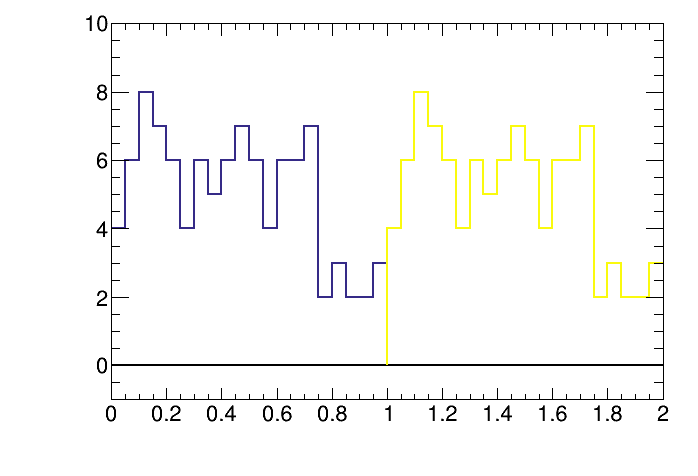
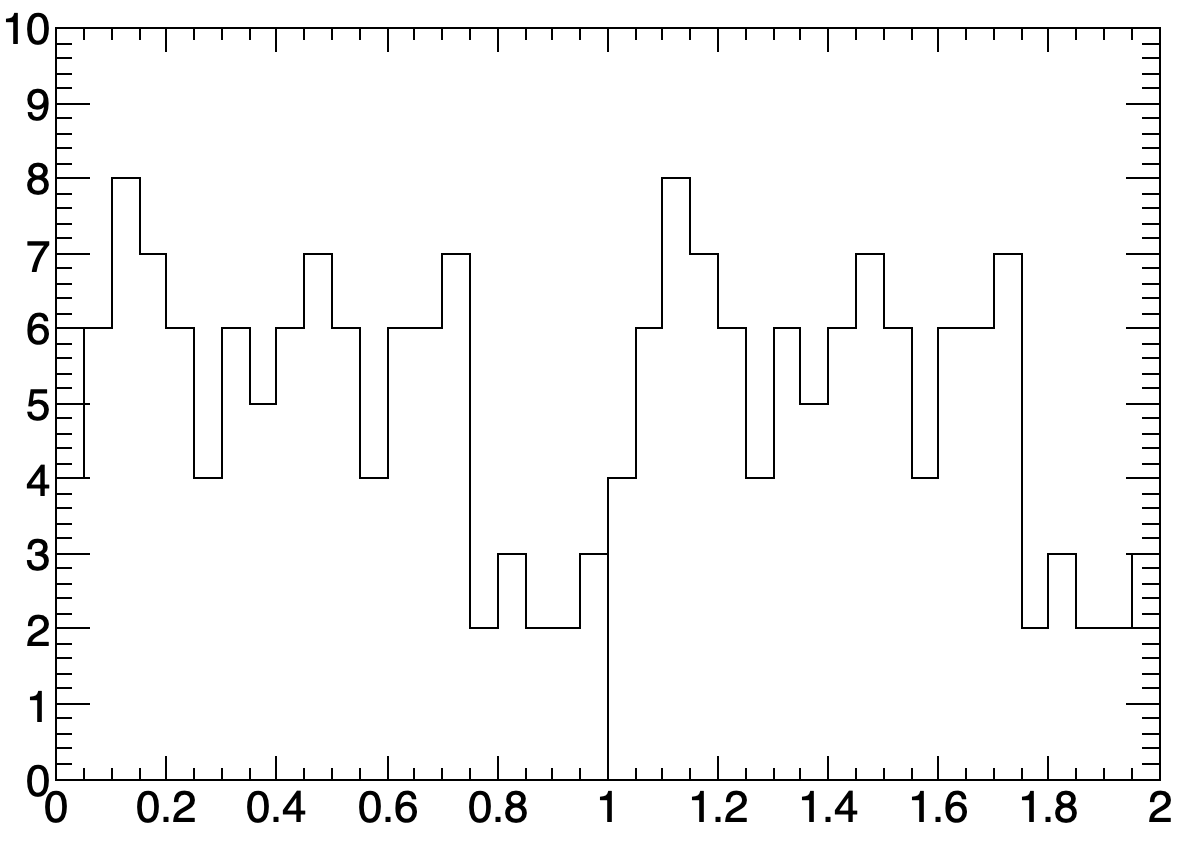
but in this plot produced by the following macro, the y=0 line still exists when there’s no negative content.


void test1 () {
  gROOT->SetStyle("ATLAS");
  
  ROOT::RDataFrame rdf(100);
  auto rdf_x = rdf.Define("x", [](){ return gRandom->Rndm(); }).Define("x1", "1+x").Filter("x>0 && x1>0");

  const int nbins = 20;
  auto h = rdf_x.Histo1D({"h","",nbins,0,1}, "x");
  auto h1 = rdf_x.Histo1D({"h1","",nbins,1,2}, "x1");

  auto hs = new THStack("hs","");
   
  hs->Add((TH1D*)h->Clone("hc0"));
  hs->Add((TH1D*)h1->Clone("hc1"));
 
  auto c = new TCanvas("c");
  hs->Draw("PLC NOSTACK");
  hs->SetMaximum(10);
  hs->SetMinimum(-1);
}


Please read tips for efficient and successful posting and posting code

ROOT Version: 6.27/01 From heads/master@84b59b6
Platform: CentOS7.9
Compiler: gcc9.3.0


Indeed there is… because you do:

 hs->SetMinimum(-1);

OK, I see…
Without hs->SetMinimum(-1) the x-axis is a bit thicker than the y-axis, therefore I thought that was the “unwanted horizontal line” again. :dizzy_face:

not in my case:

If I comment out this line
//gROOT->SetStyle("ATLAS");
the x-axis is no longer slightly thicker.

Thanks.

gROOT->SetStyle("ATLAS");

does not make a thick line for me.

@couet I also get the “thick line” at zero. Try to remove “PLC” from draw options (also histograms’ lines will be “thick”), but leave the “SetStyle”.

void test1 () {
  gROOT->SetStyle("ATLAS");

  ROOT::RDataFrame rdf(100);
  auto rdf_x = rdf.Define("x", [](){ return gRandom->Rndm(); }).Define("x1", "1+x").Filter("x>0 && x1>0");

  const int nbins = 20;
  auto h = rdf_x.Histo1D({"h","",nbins,0,1}, "x");
  auto h1 = rdf_x.Histo1D({"h1","",nbins,1,2}, "x1");

  auto hs = new THStack("hs","");

  hs->Add((TH1D*)h->Clone("hc0"));
  hs->Add((TH1D*)h1->Clone("hc1"));

  auto c = new TCanvas("c");
  hs->Draw("NOSTACK");
  hs->SetMaximum(10);
}

ROOT 6.26/04 on Ubuntu 22.04 / x86_64 … click the plot to see its original resolution.

What does it show when you save it as pdf?

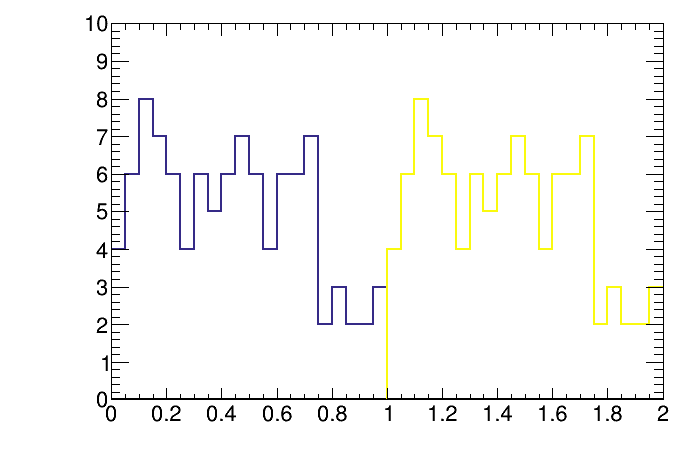
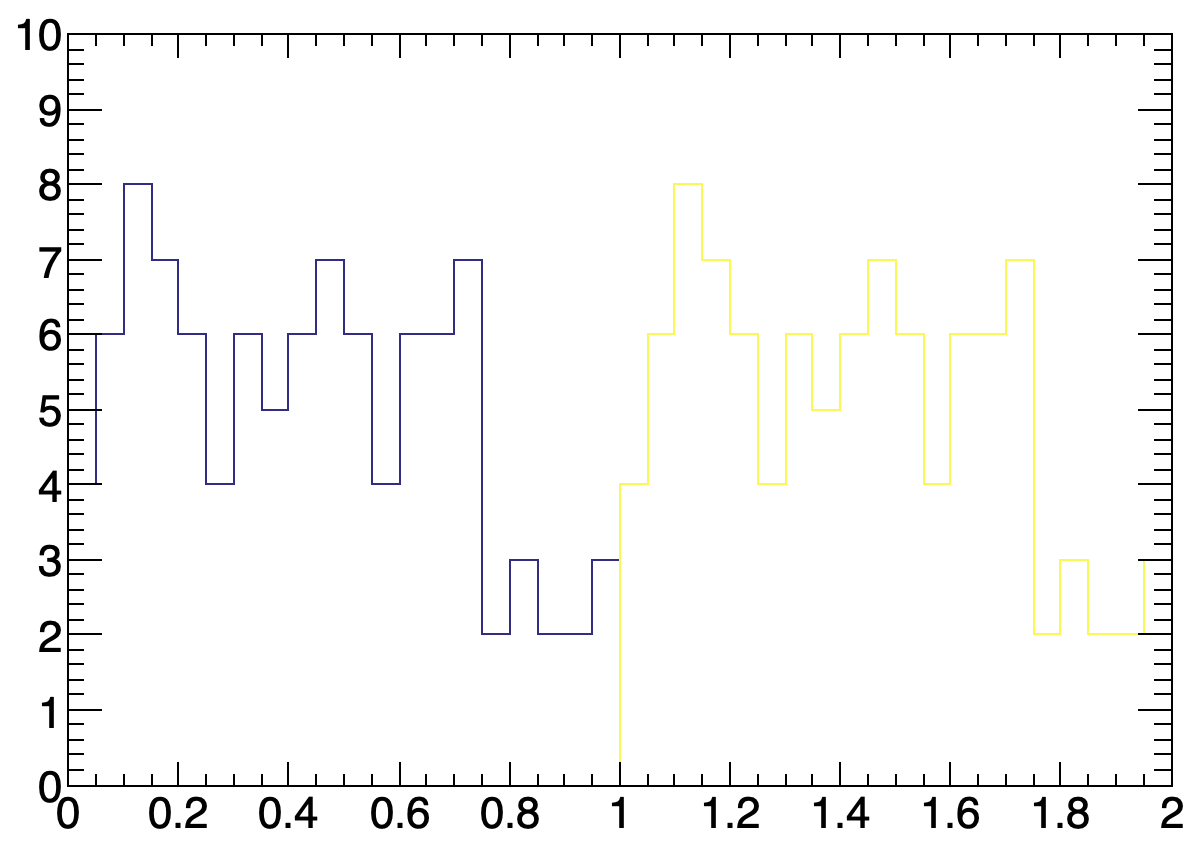
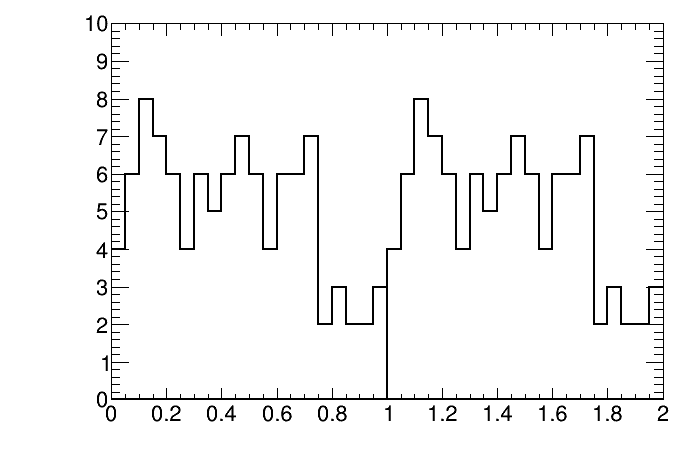
The axes are thicker for pdf and ps files, making it more difficult to notice. But, if I switch antialiasing off, the line at zero is clearly as “thick” as the rest of the histograms.

Try this one:

void test1 () {
   gROOT->SetStyle("ATLAS");
   gStyle->SetHistLineWidth(1.);

   ROOT::RDataFrame rdf(100);
   auto rdf_x = rdf.Define("x", [](){ return gRandom->Rndm(); }).Define("x1", "1+x").Filter("x>0 && x1>0");

   const int nbins = 20;
   auto h = rdf_x.Histo1D({"h","",nbins,0,1}, "x");
   auto h1 = rdf_x.Histo1D({"h1","",nbins,1,2}, "x1");

   auto hc0 = (TH1D*)h->Clone("hc0");
   hc0->SetLineWidth(3.);
   hc0->SetLineColor(kBlue);
   auto hc1 = (TH1D*)h1->Clone("hc1");
   hc1->SetLineWidth(3.);
   hc1->SetLineColor(kRed);

   auto hs = new THStack("hs","");
   hs->Add(hc0);
   hs->Add(hc1);

   auto c = new TCanvas("c");
   hs->Draw("NOSTACK");
   hs->SetMaximum(10);
   c->Print("c.pdf");
}

@couet This works because you overwrite the “ATLAS” style setting with “SetHistLineWidth” (the additional line at zero is then as thick as the axis, so you do not see that it is still there).

Yes, that’s the idea. This is a workaround.

A proper workaround:

   hs->Draw("NOSTACK");
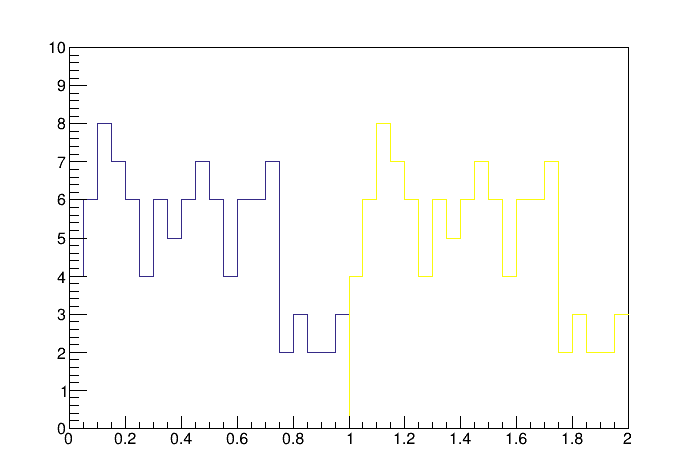
   hs->GetHistogram()->SetLineWidth(0); // "remove" the line at zero
   hs->SetMaximum(10.);
   hs->SetMinimum(-1.);
   gPad->Modified(); gPad->Update();

@couet It seems to me that this “fix” should be added to the THStack painter (so that the line at zero is automatically not drawn when “NOSTACK” is used).

Yes, might be. I’ll check. Thanks.

PR here: THStack histogram line width should be 0 by couet · Pull Request #11013 · root-project/root · GitHub.
Thanks to have seen this issue !

1 Like

By the way, with that fix, the horizontal line at 0 also disappears when you set the minimum to -1 (like in your first post).

1 Like

This topic was automatically closed 14 days after the last reply. New replies are no longer allowed.