HI,
i would like to draw the contours 0.5, 1. , 2. On my histogram, I used (“cont list”) but I do not know how it is applied. you have an idea please?, my code is attached below.
thanks
graphkhi2.C (862 Bytes)
HI,
i would like to draw the contours 0.5, 1. , 2. On my histogram, I used (“cont list”) but I do not know how it is applied. you have an idea please?, my code is attached below.
thanks
graphkhi2.C (862 Bytes)
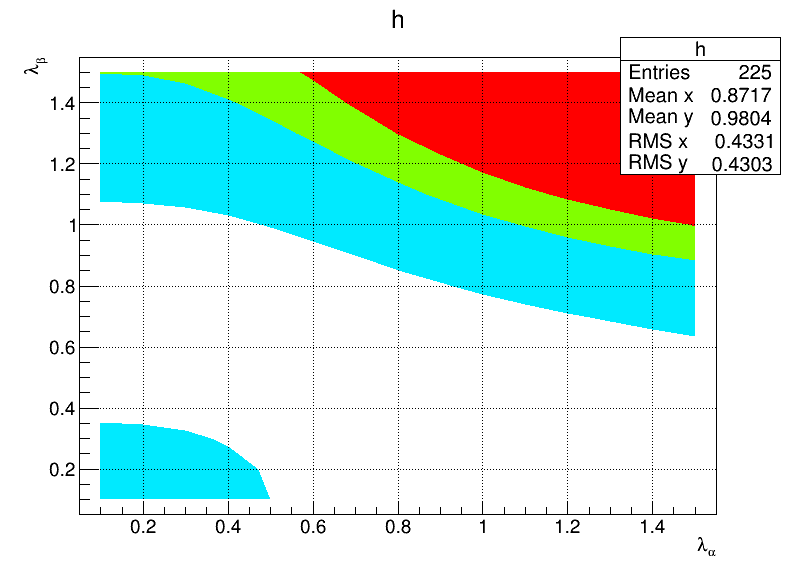
The contour you choose where not in the Z range. I modified you macro using 3 contours in the range (see attached macro) and I get the attached picture.
thank you very much, so for exemple there must be contour[1]=100 and not 1, ok I understand,
Many thanks  .
.
Yes your histogram Z-min and Z-max are: 32.3786 and 187.074
Your contours (not only contours[1]) should be inside this range.
I have another question please, have you an idea: how we draw a tangent to a contour?, for example if I want to draw a tangante “contour [1]”.
I search the intersection of the tangent with the axis X and Y of my histogram , if I have a closed contour for exemple.
thanks
You want an automatic way to find the tangent at a point ?
I guest you would have to retrieve the contour as a graph then use some math algorithm to compute it.
I’m sorry but I want to draw my outlines from a point “chi2min” (X = 0.55, Y = 0.59 : intersection of two straight lines (in alpha_lambda_chi2.ps)),
as the following graph attached (second graph.ps), but i must repeat this graph with root => if I draw contour[0] = 10 =>I find a closed contour,
thanks
graph.ps (12.3 KB)
alpha_lambda_chi2.ps (11.1 KB)
try this:
graphkhi2.C (876 Bytes)