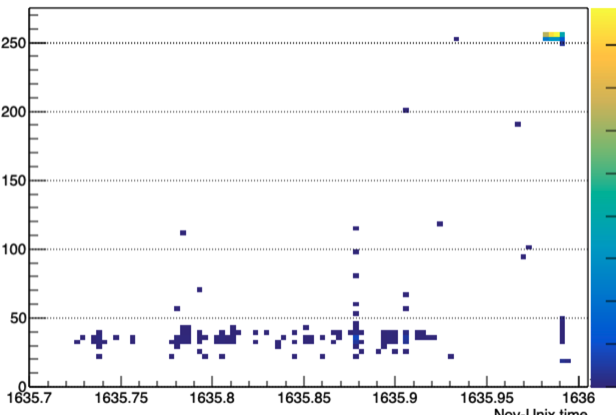
I am trying to add unix time on X-axis instead of date,
also I didn’t understand the use of
‘’'noise=f.Gaus(0.5*(X1+X2), 0.1*(X2-X1))
for(Int_t f = 0; f < nEntries; f++) //loop over to fill the histogram
{
    currentAna->GetEntry(f);
    //Double_t noise = f.Gaus(0.5*(X1+X2), 0.1*(X2-X1))
    curr_vals->Fill(abs(Curr));
}
What do you call “unix time” ? if that’s the number of seconds since 1970 (the standard definition) you can just use an integer. No need for a time axis.
Thank You,
I tried but it changes the unix time to notation. I tried decreasing the X-axis label size but it didn’t worked.
Is there any way to include the unix time?
Unix time is seconds, that’s an integer how can the “unix time notation” be changed ? it is just integers. Do you have an example showing what is wrong ?
TH2D *hist = new TH2D("hist", "Current vs Time", 100, 1635742801000, 1638338399000, 80, 20, 200);
The value you entered are bigger than the largest integer authorised in C++. try to google “largest integer C++” . I suggest you apply an offset (substrate some fixed value) to reduce the range.