Hello experts,
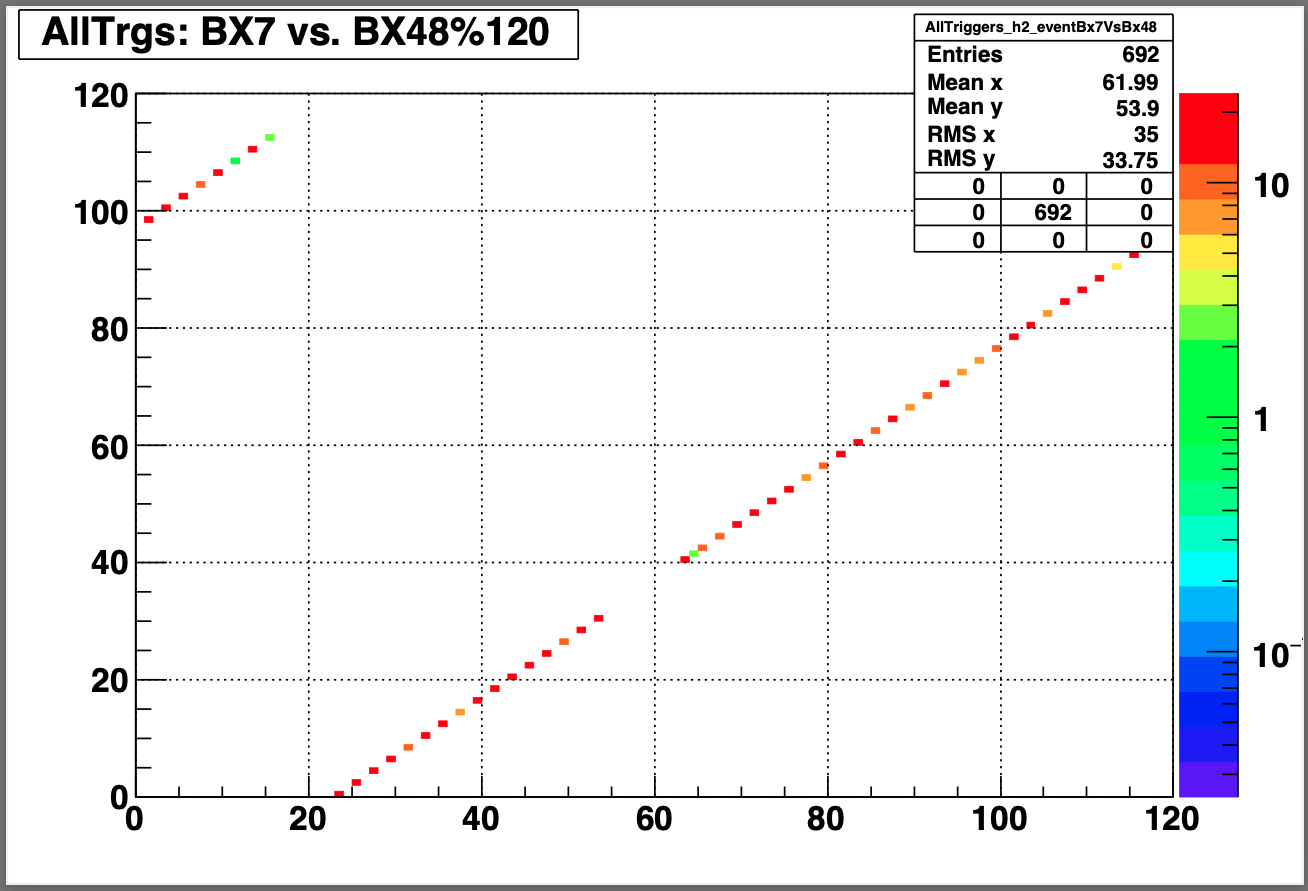
I am having an issue when plotting a 2D histogram with the “colz” option. When I look at the z-axis, the numbers on the ticks are not fully displayed. It is as if the numbers go beyond what the canvas can show. Notice how the 10^-1 is chopped off on the z-axis. I checked other topics on this forum, but non of them addressed my issue. Can you please help me with this? Thank you very much in advance!
Here is the relevant code:
        TString inputFileName = TString("./qaTest_2022pp500_22351049.hist.root");
        TFile* inputFile      = new TFile(inputFileName.Data());
        TCanvas *c1 = new TCanvas("c1");
        gStyle->SetOptDate(0);
        gStyle->SetOptStat(111111);
        gStyle->SetStatY(0.99);
        gStyle->SetStatX(0.9);
        gStyle->SetStatW(0.2);
        gStyle->SetStatH(0.12);
        TH2D* Th2Hist_1 = (TH2D*)inputFile->Get("AllTriggers_h2_eventBx7VsBx48");
        c1->SetLogz();
        Th2Hist_1->Draw("colz");
The output is: