Hello,
I noticed that depending on the order of operations I can end up with the colz color scale above the statistics box.
Example :
TCanvas c
TH2F h2("h2", "h2", 100, 0, 99, 100, 0, 99);
TPaveText tpt(0.79, 0.6, 0.95, 0.7, "NDC")
h2.Draw("colz")
tpt.Draw()
h2.Fill(50, 50)
c.Modified()
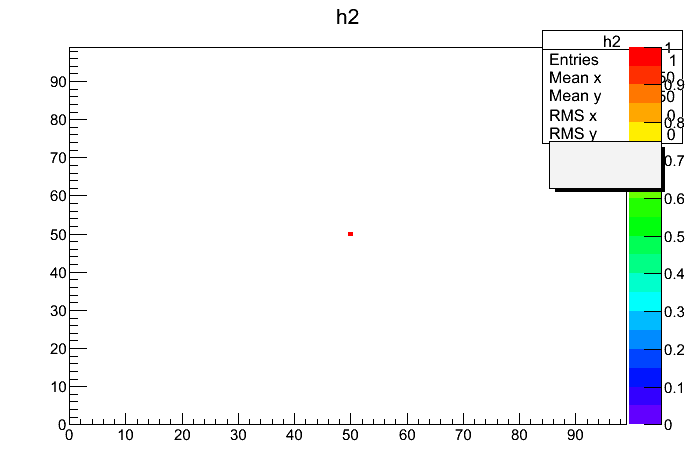
See the attachment for the result. The statistics box is below the scale, whereas the tpavetext is above. To be noted that in my application I see sometimes the tpavetext under the scale as well.
Is it the expected behaviour ? shouldn’t the scale always be at the level of the plot ? How can I force this ?
Thank you for your help
barth