Color palette for z-axis ignoring empty bins

As is known, if the min and max of histogram isn’t set, ROOT chooses some “default” values for them. This usually works, but I wonder if it’s possible to get this to be more user-friendly.

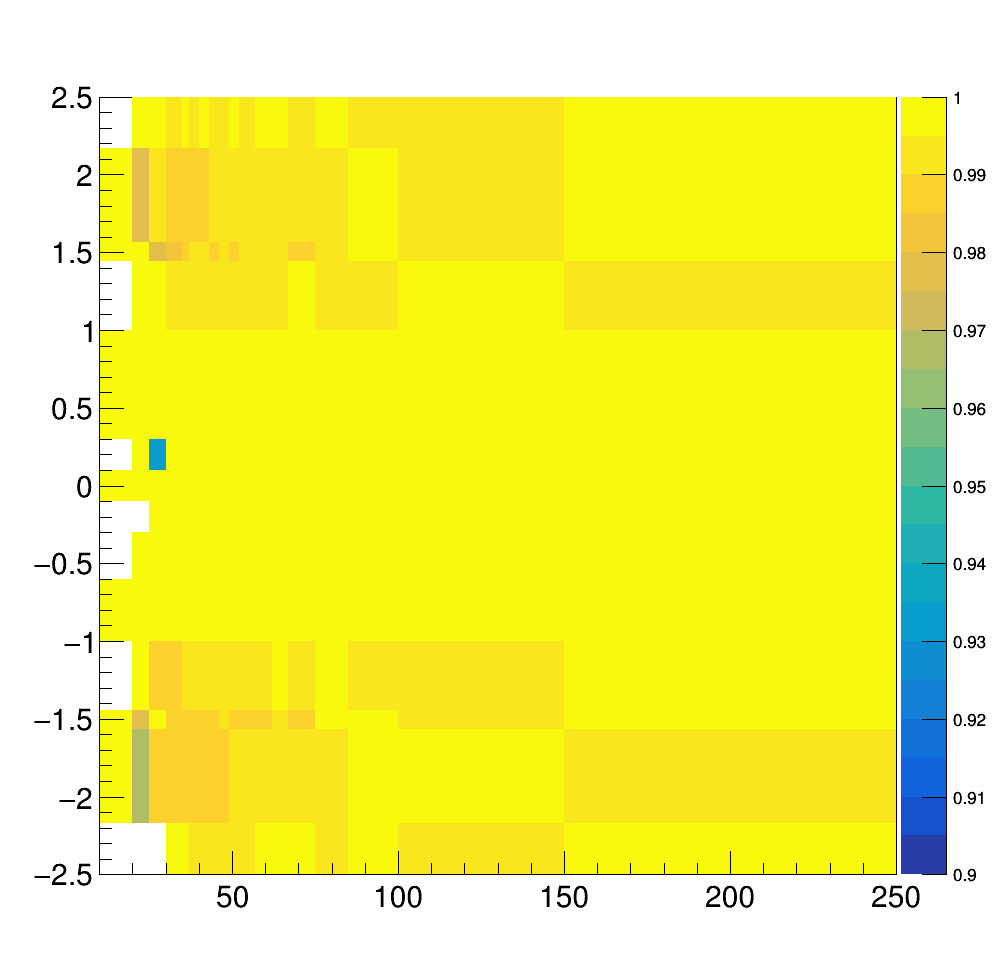
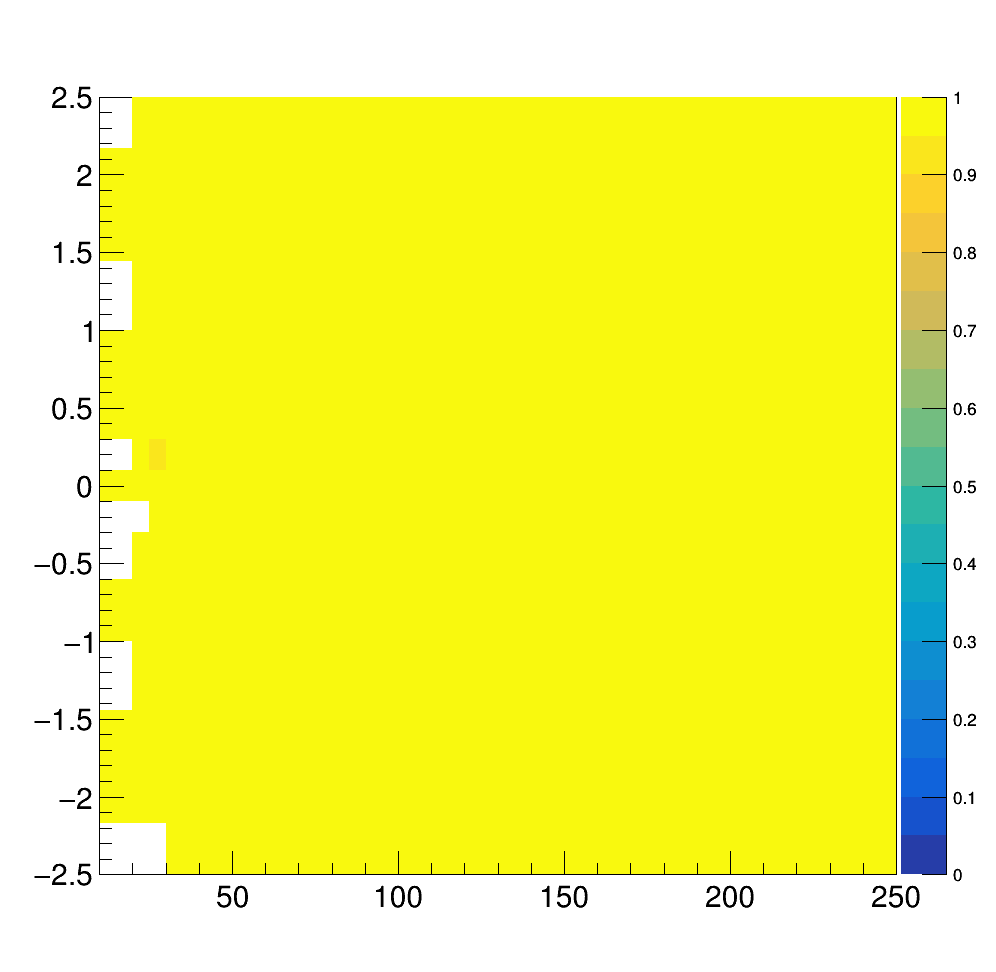
To see what I mean, let;s compare the 2 attached plots. test1 is just drawn simply, while test2 had SetMinimum(0.9) and SetMaximum(1.) applied. It’s clear that test2 is “richer” than test1 despite them being exactly the same plot. The problem is that in defining the z-axis, the color palette takes into account the empty unfilled bins, thus washing out any features present in filled bins.

So, it would be really great if there is a way to have the default palette defined in such a way that these bins are ignored. Sure, SetMinMax works, but it’s not very practical to tailor this individually for large amount of plots and the default range usually works well enough, if only we can get around this problem.

Cheers,
Afiq

Can you provide a small macro reproducing what you are talking about ?

I’m not sure what kind of macro you have in mind as this generally applies to all TH2 but ok, maybe something like [1]. Up to the first Draw() there is no min/max set so the palette takes the unfilled bins into account. But in fact the bins all have content in a rather narrow range which is far from 0, so by setting the min/max appropriately we get to see more of the features in the histogram.

However, considering that ROOT selects the default range pretty well already for fully-filled histograms, it’d be very convenient if the untouched bins are ignored in this step, as efficiency histograms for example are made with a routine not too different from the (admittedly unrealistic) example below.

Cheers,
Afiq

[1]

TH2D *th2 = new TH2D("test", "", 5, 0., 5., 5, 0., 5.);
th2->SetBinContent(2, 2, 0.75); 
th2->SetBinContent(2, 3, 0.73); 
th2->SetBinContent(2, 4, 0.85);
th2->SetBinContent(2, 5, 0.83);
th2->SetBinContent(3, 2, 0.9); 
th2->SetBinContent(3, 3, 0.85); 
th2->SetBinContent(3, 4, 0.77);
th2->SetBinContent(3, 5, 0.79);

th2->Draw("colz");

th2->SetMinimum(0.7);
th2->SetMaximum(0.9);
th2->Draw("colz");
```

Thanks, It is always better to agree on a example :slight_smile:

when I do:

{
   TH2D *th2 = new TH2D("test", "", 5, 0., 5., 5, 0., 5.);
   th2->SetBinContent(2, 2, 0.75);
   th2->SetBinContent(2, 3, 0.73);
   th2->SetBinContent(2, 4, 0.85);
   th2->SetBinContent(2, 5, 0.83);
   th2->SetBinContent(3, 2, 0.9);
   th2->SetBinContent(3, 3, 0.85);
   th2->SetBinContent(3, 4, 0.77);
   th2->SetBinContent(3, 5, 0.79);
   cout << "Minimum = " <<  th2->GetMinimum() << endl;
   th2->Draw("colz");
}

I get:

Minimum = 0

when I do:

{
   TH2D *th2 = new TH2D("test", "", 5, 0., 5., 5, 0., 5.);
   th2->SetBinContent(2, 2, 0.75);
   th2->SetBinContent(2, 3, 0.73);
   th2->SetBinContent(2, 4, 0.85);
   th2->SetBinContent(2, 5, 0.83);
   th2->SetBinContent(3, 2, 0.9);
   th2->SetBinContent(3, 3, 0.85);
   th2->SetBinContent(3, 4, 0.77);
   th2->SetBinContent(3, 5, 0.79);
   th2->SetMinimum(0.7);
   cout << "Minimum = " <<  th2->GetMinimum() << endl;
   th2->Draw("colz");
}

I get:

Minimum = 0.7

Seems to me two plots are correct. Which one would like to change ?
Both are using the minimum vale the GetMinimum() method returns …

Well… yes. Of course both are correctly using the ranges of the histogram in its current state, but in this case, the “0” is only because the bins are untouched and the touched bins are positive.

As the min/max accordingly update themselves as bin content are changed, I think there is another way to put this question: is there a method to make this update take into account only touched bins and ignore the rest? This would achieve the same effect as far as axis ranges are considered.

Cheers,
Afiq

I think we are back to the discussion present in the ref guide

To summarise: when an histogram with positive contain only is drawn with option COL the empty bins are not painted … we do not know if they are touched or un-touched (a bin can have a 0 content because it was never touched or touched several times with a sum equal to 0) but they are assumed un-touched.

Sill the histogram minimum being zero, the palette goes from 0 to the maximum …

So what you are looking for is a way to define the palette from the lowest non null value to the highest value.

There is already a simple way to do that:

   th2->SetMinimum(th2->GetMinimum(0.)); th2->Draw("colz");
1 Like

Just what I’m looking for. Perfect.

Thanks,
Afiq

This topic was automatically closed 14 days after the last reply. New replies are no longer allowed.