Hi all,
I am having some troubles in trying to build my own color palette for a TH2F.
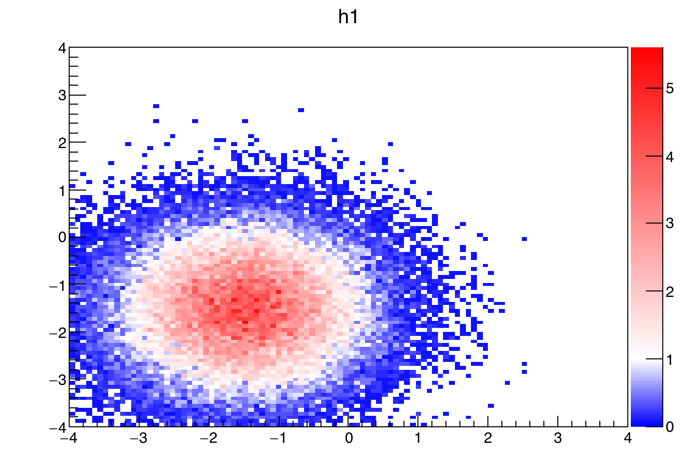
I would like to plot it in such a way that if the bin content is equal to 1 the color would be white, if the bin content is less than 1 the color would be blueish and if the bin content is larger than 1 the color would be reddish.
I have done something like this:
double min = h11->GetMinimum();
double max = h11->GetMaximum();
double perc = (1. - min)/(max - min); //in order to find the percentage of table from min to 1
int N = 3, NCont = 128;
Double_t stops[N] = { 0.00, perc, 1.00 };
Double_t red[N] = { 0.00, 1.00, 1.00 };
Double_t green[N] = { 0.00, 1.00, 0.00 };
Double_t blue[N] = { 1.00, 1.00, 0.00 };
int FI = TColor::CreateGradientColorTable(N, stops, red, green, blue, NCont);
h11->Draw(“colz”);
In this way, as far as I understood, it should use for the first “perc” of the table colors for going from blue to white and for the rest colors for going from white to red.
However, it does not seem to do so. I have, for instance, min = 0.951374, max = 1.04497 and perc = 0.51951, but, instead of going from blue to white for the first 51% of the table (which is where 1 is), it arrives at white already for bin content values of 0.975 (around at the 25% of the table).
What am I doing wrong?
Thank you very much for your time and your help!
Best Regards,
Ilenia