Hi ,
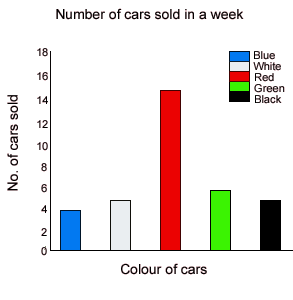
In my histogram three lines have a different color , i want to explain the coloers in my histogram as the picture in attachment , How can I do this in root?
Larin
Hi ,
In my histogram three lines have a different color , i want to explain the coloers in my histogram as the picture in attachment , How can I do this in root?
Larin
The simplest way to do that is to have one histogram per color, group then in a THStack and draw the THStack
   TH1F * hst11 = new TH1F("hst11", "", 20, -10, 10);
   hst11->FillRandom("gaus", 1000);
   hst11->SetFillColor(kViolet);

   TH1F * hst12 = new TH1F("hst12", "", 20, -10, 10);
   hst12->FillRandom("gaus", 500);
   hst12->SetFillColor(kBlue);

   THStack st1("st1", "st1");
   st1.Add(hst11);
   st1.Add(hst12);

   st1.Draw();
Thank you
but I want also do same the box right in my picture , How can I do this in root?
In the end of Olivier’s macro add: TLegend *l = new TLegend(0.7, 0.8, 0.89, 0.89);
l->SetBorderSize(0);
l->AddEntry(hst11, "Violet", "f");
l->AddEntry(hst12, "Blue", "f");
l->Draw();