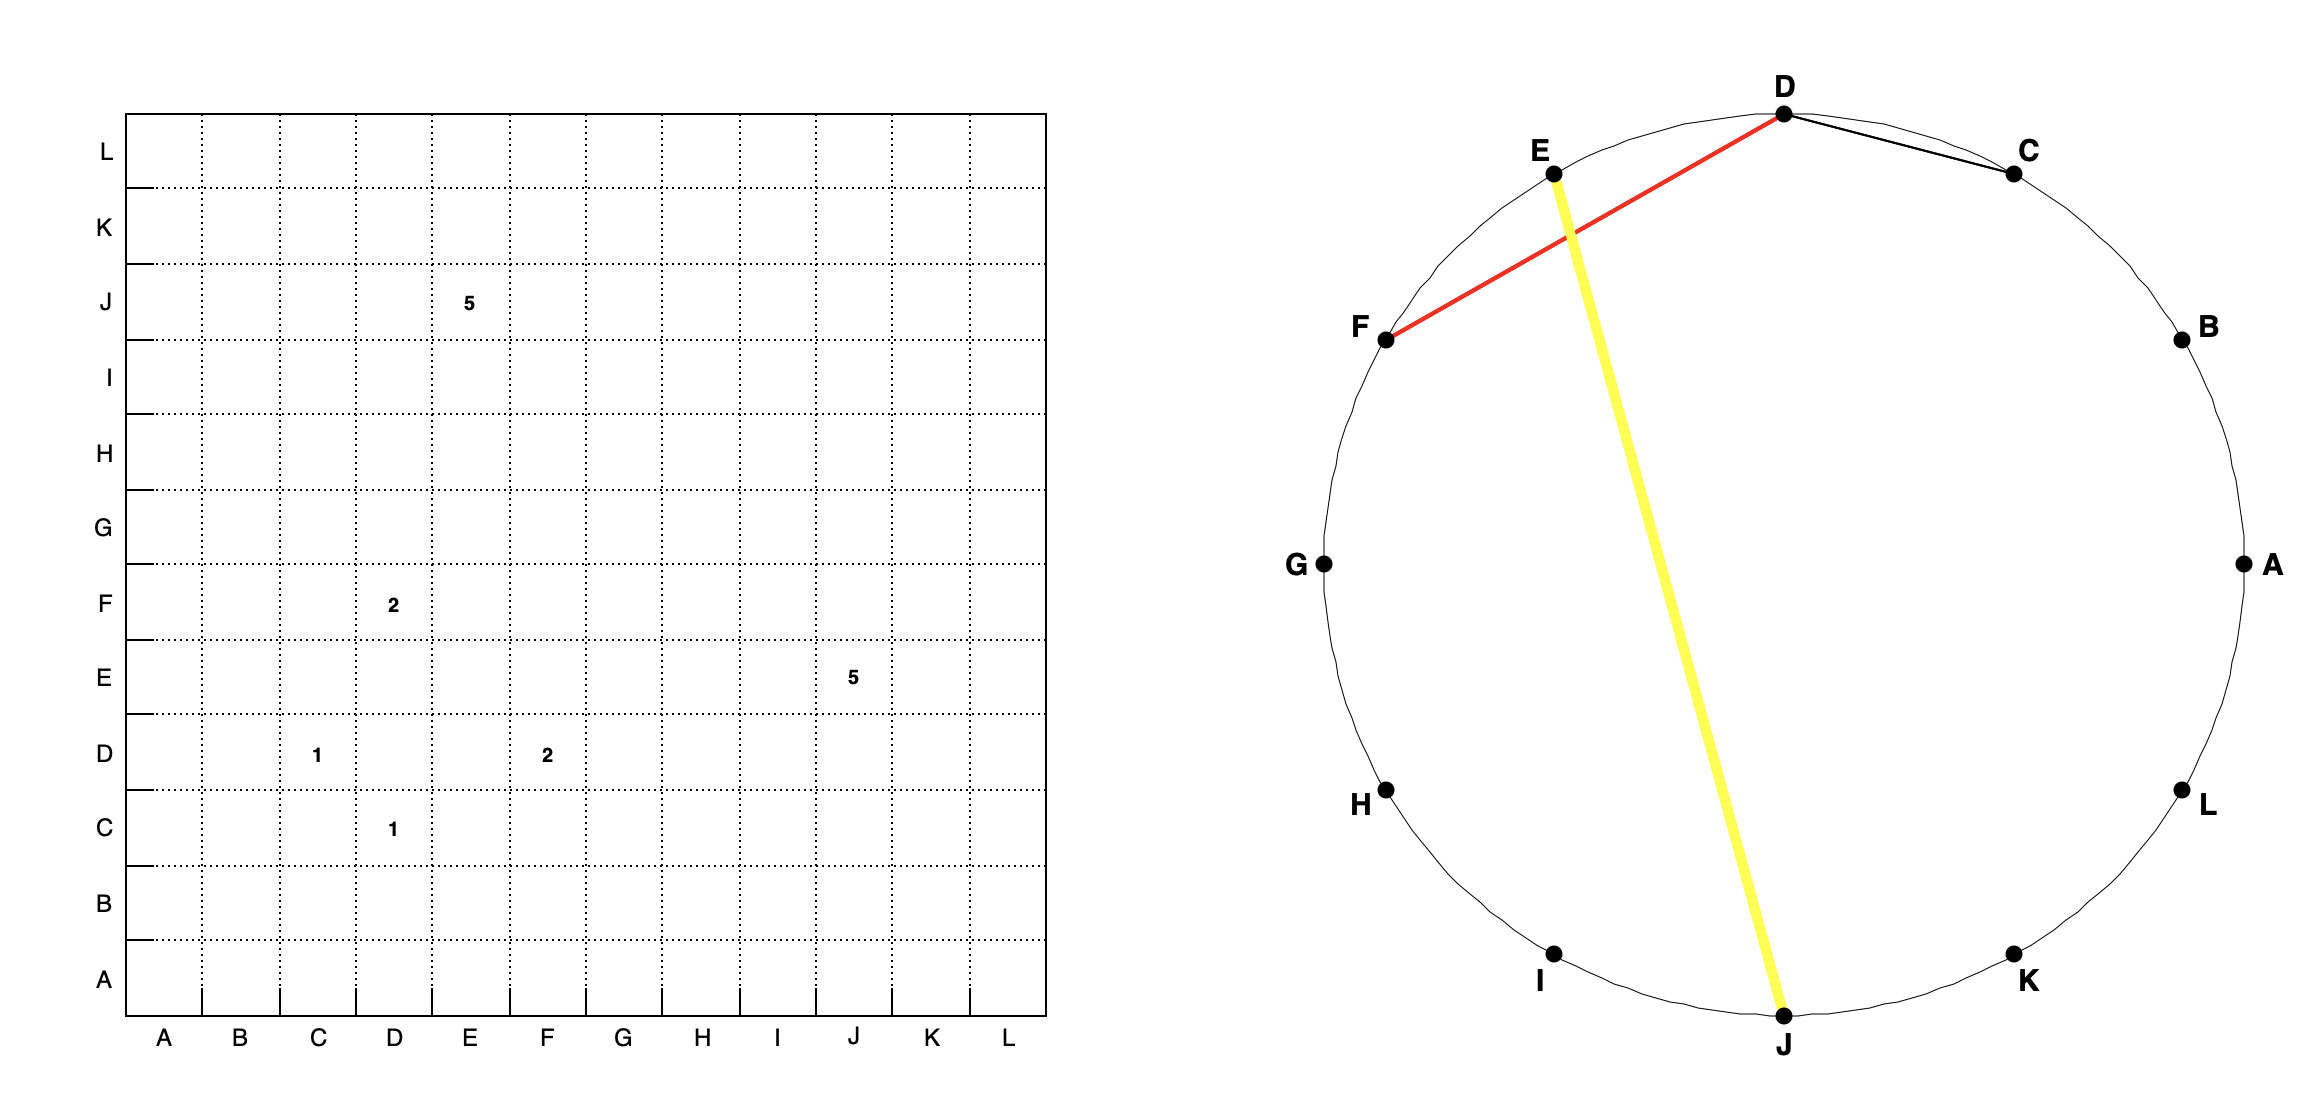
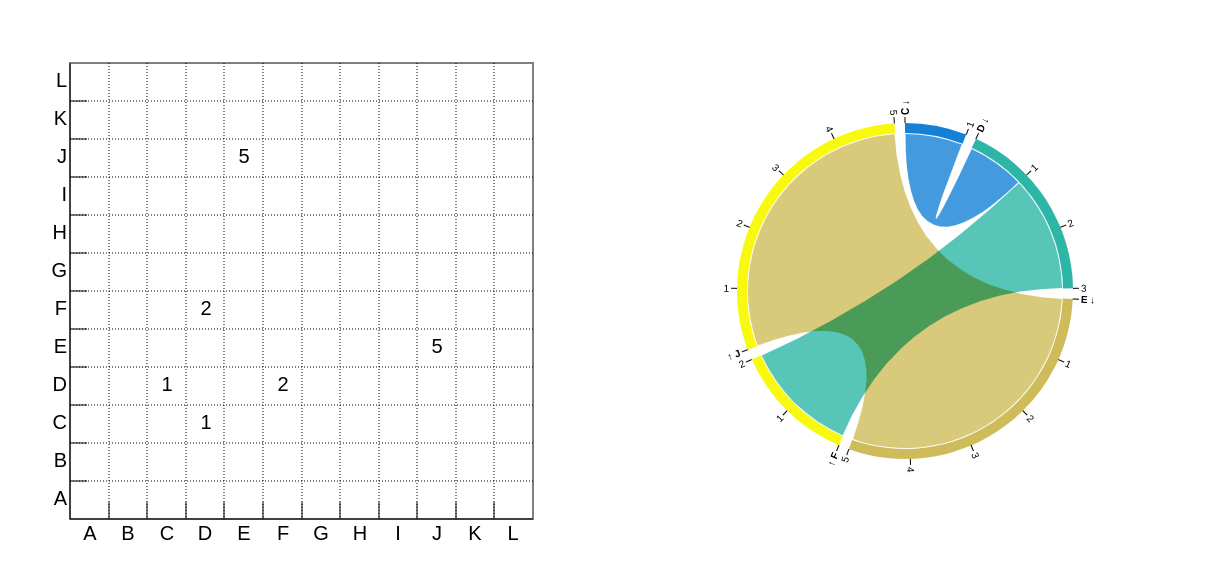
Here is a “quick and dirty” macro producing a circular graph. It is really just the basic structure … nothing you can use … just the idea:
TCanvas *c1;

void chord(TH2F *h)
{
   c1->cd(2)->Range(-1, -1, 1, 1);;
   TEllipse *circle = new TEllipse(0., 0., 0.8);
   circle->SetLineWidth(1);

   circle->Draw("L");
   TAxis *xaxis;
   xaxis=h->GetXaxis();
   THashList *labels = xaxis->GetLabels();
   int ndiv = xaxis->GetLast()-xaxis->GetFirst()+1;
   float da = 2*TMath::Pi()/ndiv;

   float ax = 0 ;
   float ay = 0;
   for (int i=1; i<=ndiv; i++) {
      for (int j=1; j<=ndiv; j++) {
         if (h->GetBinContent(i,j)>0){
            auto l = new TLine(0.8*TMath::Cos(ax), 0.8*TMath::Sin(ax),
                               0.8*TMath::Cos(ay), 0.8*TMath::Sin(ay));
            l->SetLineWidth(h->GetBinContent(i,j));
            l->SetLineColor(h->GetBinContent(i,j));
            l->Draw();
         }
         ay = ay+da;
      }
      ay = 0;
      ax = ax+da;
   }

   TIter next(labels);
   auto t= new TText();
   t->SetTextAlign(22);
   t->SetTextSize(0.03);
   auto  m = new TMarker();
   m->SetMarkerStyle(20);

   float a = 0;
   while (TObject *obj = next()) {
      t->DrawText(0.85*TMath::Cos(a), 0.85*TMath::Sin(a), obj->GetName());
      m->DrawMarker(0.8*TMath::Cos(a), 0.8*TMath::Sin(a));
      a = a+da;
   }
}

void chord_diagrams()
{
   const Int_t n = 12;
   const char *L[n]  = {"A","B","C","D","E","F","G","H","I","J","K","L"};

   c1 = new TCanvas("c","c",10,10,1200,600);
   c1->Divide(2,1);

   auto *h = new TH2F("h","",n,0,1,n,0,1);
   h->SetStats(0);

   for (int i=0;i<n;i++) h->Fill(L[i],L[i],0);

   h->Fill(L[2],L[3],1);
   h->Fill(L[3],L[2],1);
   h->Fill(L[5],L[3],2);
   h->Fill(L[3],L[5],2);
   h->Fill(L[9],L[4],5);
   h->Fill(L[4],L[9],5);

   c1->cd(1)->SetGrid();
   h->Draw("text");
   chord(h);
}