Hi everybody
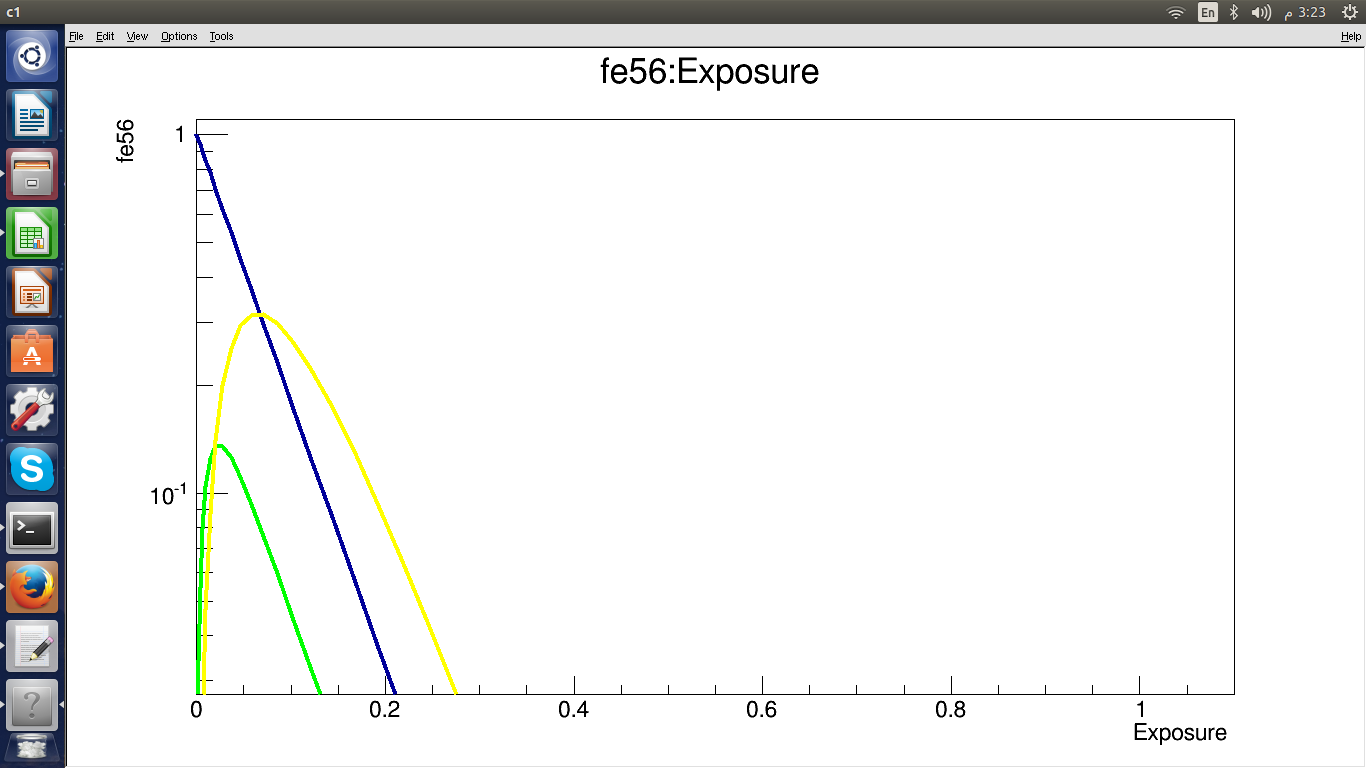
i have a problem in Graph i’m trying to plot from 2 txt files and produce figures between the branches, the problem that after i draw and setlogy the range on yaxis not as expected so where is the problem ???
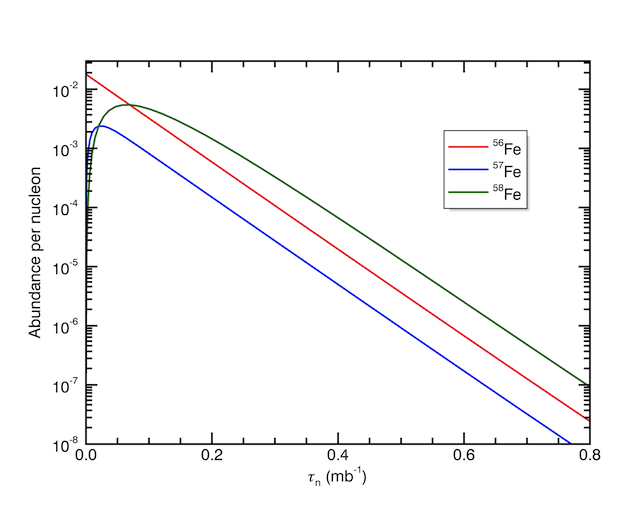
here are my graph and the expected one
also the C file and the data
thnx
exposure.txt (1.39 KB)
fe.txt (1.95 KB)
try27.C (920 Bytes)
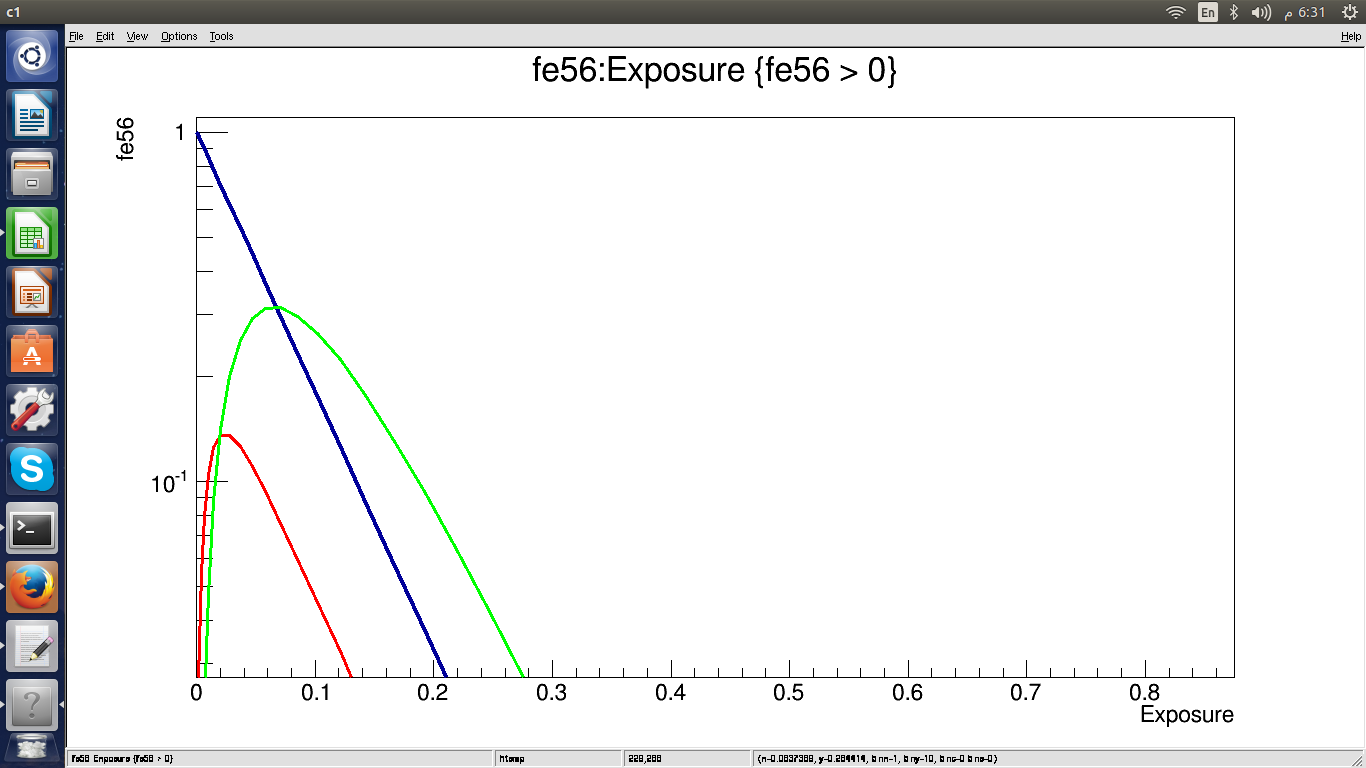
Try with: expo->Draw("fe56:Exposure", "fe56 > 0", "L");
expo->Draw("fe57:Exposure", "fe57 > 0", "L SAME");
expo->Draw("fe58:Exposure", "fe58 > 0", "L SAME");
Thank you Mr @Pepe Le Pew for your reply,
but stil the same problem
here is the graph after your modifications
thanks again
Hi Mr @Pepe Le Pew
I retry to graph but stil the same
can i see your try27.C file
idon’t know where is the problem
I tried it with ROOT 5.34/36 and 6.06/02.
Check your “.rootrc” , “rootlogon.C”, “.rootlogon.C” and “rootalias.C” files in your “${HOME}” and in the “current subdirectory” (i.e. where you start the ROOT executable).
try27.C (832 Bytes)
Thanks Mr Pepe Le Pew
I had execute try27.C again and still the same
i had root ver. 5.34.14-1build1
my laptop is 64-bit and the processor Intel® Core™ i7-5500U CPU @ 2.40GHz × 4
what do you think ??
Hi Mr @ Pepe Le Pew
I Can’t find “.rootrc” , “rootlogon.C”, “.rootlogon.C” and “rootalias.C” files in my "${HOME}"
what can i do
thank you very much
I did some checks and it seems that you need at least ROOT 5.34/20 (note: you are best advised to take the newest ROOT 5.34/36), unless Olivier can give you some trick which will overcome your problem in your ROOT 5.34/14.
BTW. Olivier, I have big problems with “zooming” the y-axis of this canvas in log scale (when using a mouse, it never sets my chosen “y-min” -> this happens for both 5.34/36 and 6.06/02).
Not really …