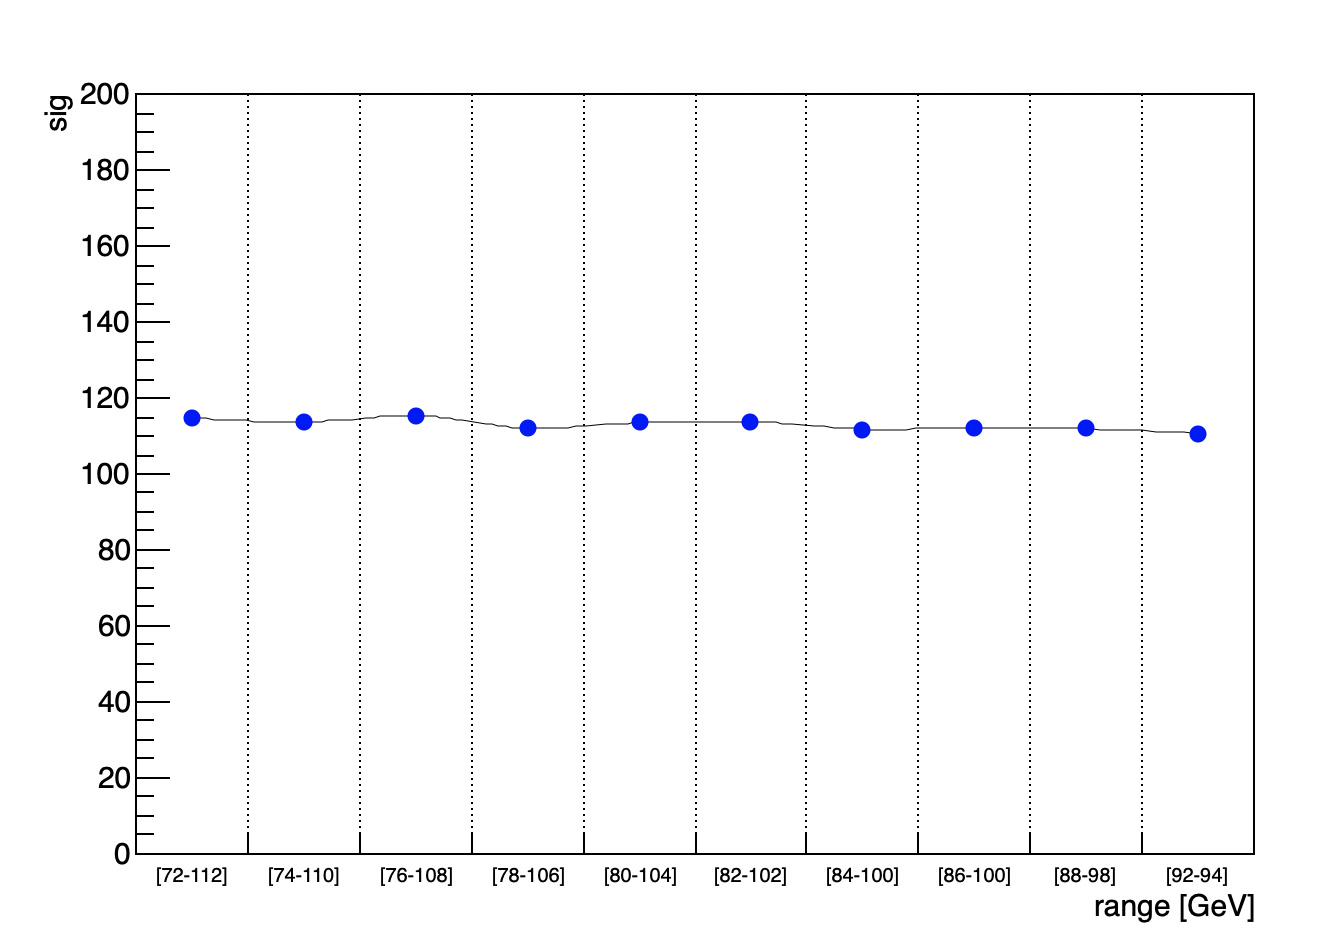
Dear all I would like to change the labels on the X axis of my graph, I have already a working code (derived from a similar topic in the root forum) how as you can see in the plot the point on the graph mismatch the ranges on the X axis (for instance I would like to have the first point of the graph to be in the middle of [72,112] range and so one), and the first and last point don’t touch the verticale lines
Could someone explain how to fix this please ?
I the code is here.
#include "TROOT.h"
#include "TObject.h"
#include "TFile.h"
#include "TTree.h"
#include "TH2.h"
#include "TMath.h"
#include "TGraph.h"
#include "TColor.h"
#include "TCanvas.h"
#include "TLegend.h"
#include <TStyle.h>
#include <iostream>

#include "AtlasStyle.h"

#include "TROOT.h"


void test()

{

   TCanvas *c1 = new TCanvas("c1","A Simple Graph Example",200,10,700,500);
const Int_t n = 10;
  char const *range[n] = {"[72-112]","[74-110]","[76-108]","[78-106]","[80-104]","[82-102]","[84-100]","[86-100]","[88-98]","[92-94]"};
   int i;
 Float_t  x[n]  = {1,2,3,4,5,6,7,8,9,10};
 Float_t  y[n]  = {114.9,113.7,115.4,112.1,113.5,113.8,111.8,112.2, 111.9, 110.7};
 TH1F *h = new TH1F("h","",n,x[0],x[n-1]);
 h->SetTitle("");
 h->GetYaxis()->SetTitleOffset(1.);
 h->GetXaxis()->SetTitleOffset(1.);
 h->GetYaxis()->SetTitle("sig");
 h->GetXaxis()->SetTitle("range [GeV]");
 for (i=1;i<=n;i++) h->GetXaxis()->SetBinLabel(i,range[i-1]);
 h->SetMaximum(200);
 h->SetStats(0);
 h->Draw("");
 TGraph *gr = new TGraph (n, x, y);
 gr->SetMarkerColor(4);
 gr->SetMarkerStyle(20);
 gr->Draw("CP");
}
Thanks in advance,
Best Regards,
Diallo.