Dear Rooters,
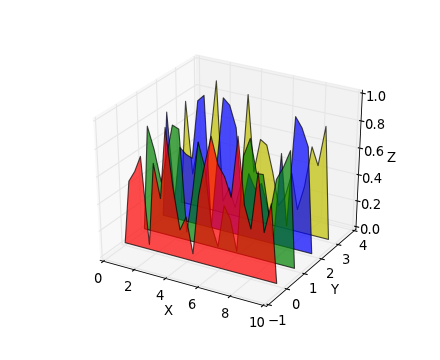
I have a question to THStack. I wanted to draw several 2d-histograms into one stack. This works very nice and is no problem for a small number of bins. If you increase the number of bins, the plot looks not very nice due to the black lines of the lego bars. Is there a possibility to change the colour of the borders of such lego bars? Maybe one can use a other root class for this. I attach a picture of a matplotlib plot from python, to get an idea, what my plot should look like. The code from the multicolor tutorial is also attached.
Thanks for your suggestions.
Best regards.
Toni
[code]// Use a THStack to show a 2-D hist with cells with different colors
// run this example with the two options
// root > .x multicolor.C
// root > .x multicolor.C(1)
//Author: Rene Brun
#include “TCanvas.h”
#include “TH2.h”
#include “THStack.h”
#include “TRandom.h”
void multicolor(Int_t stack=0) {
gROOT->Reset();
gStyle->SetPalette(1);
TCanvas *c1 = new TCanvas;
Int_t nbins = 200;
TH2F *h1 = new TH2F(“h1”,“h1”,11,-4,4,nbins,-4,4);
h1->SetFillColor(kBlue);
h1->SetMarkerColor(kBlue);
h1->SetLineColor(kBlue);
TH2F *h2 = new TH2F(“h2”,“h2”,11,-4,4,nbins,-4,4);
h2->SetFillColor(kRed);
h2->SetMarkerColor(kRed);
h2->SetLineColor(kRed);
TH2F *h3 = new TH2F(“h3”,“h3”,11,-4,4,nbins,-4,4);
h3->SetFillColor(kYellow);
h3->SetMarkerStyle(21);
h3->SetMarkerColor(kYellow);
h3->SetLineColor(kYellow);
THStack *hs = new THStack(“hs”,“three plots”);
hs->Add(h1);
hs->Add(h2);
hs->Add(h3);
TRandom r;
Int_t i;
for (i=0;i<20000;i++) h1->Fill(0.,r.Gaus());
for (i=0;i<20000;i++) h2->Fill(-2.,r.Gaus());
for (i=0;i<20000;i++) h3->Fill(2.,r.Gaus());
hs->Draw(“lego1, 0”);
}[/code]