Dear experts,
I am wondering if producing such plot is possible to do in root. If so, what object and approach would you advice to use?
Short example with pyroot is appreciated!
Thanks!
There is no such drawing option in ROOT. In which format are your data ? trees ? histograms ?
OK…that’s unfortunate.
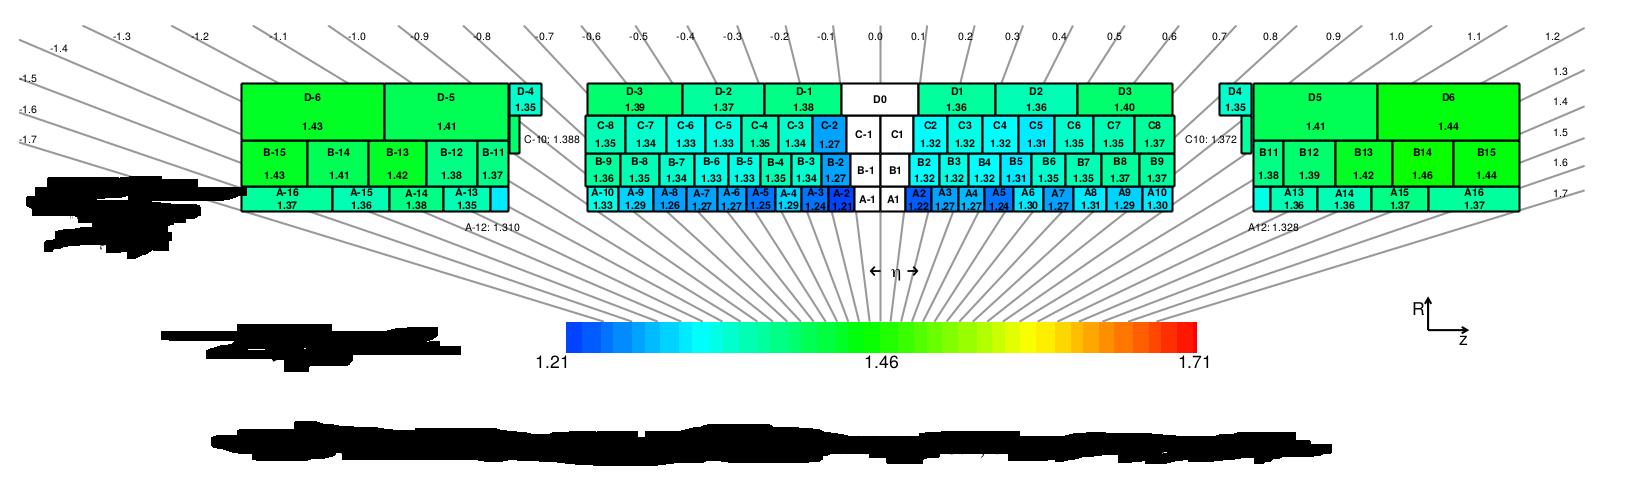
Each of the value of the cell are saved in separate root file as TParameter. My initial idea is to loop through those root files, extract the TParameter, and somehow plot them in such a plot.
Ok, that’s very specific … You can also make a macro making this kind of drawing. But that’s a fair amount of coding. What’s the name of such plot ? I would like to understand how it should be read …
This is a tile calorimeter cell map of the ATLAS detector. Each value represent an observable specific to that cell.
May be a TH2Poly is the best ROOT object to be used to represent this data.
Why not ask the ATLAS people how they do it instead of trying to reinvent the wheel?
Well that’s the first thing I did. This is a legacy plot which source code was not preserved and whose owner had left the field.