Hello Experts,
I am having a confusing problem when trying to plot. I want to split a canvas vertically into three different pads and plot a specific range of a TGraphErrors object in each one of the vertical pads. The following is the relevant portion of my code:
        TCanvas* testCanvas = new TCanvas();
        testCanvas->Divide(1,3);

        testCanvas->cd(1);
        TGraphErrors* graph_pad1 = new TGraphErrors(numberOfRuns, runIndexArr, hitosMeans, xAxisErr, histoMeanUncert);
        graph_pad1->SetMarkerStyle(22);
        graph_pad1->SetMarkerColor(4);
        graph_pad1->SetName(graphName);
        graph_pad1->SetTitle(histoTitle);
        graph_pad1->Draw("AP");
        graph_pad1->GetXaxis()->SetRangeUser(0,6);
        gPad->Modified();
        gPad->Update();

        testCanvas->cd(2);
        TGraphErrors* graph_pad2 = ((TGraphErrors*)(graph_pad1->DrawClone("AP")));
        graph_pad2->GetXaxis()->SetRangeUser(7,12);
        gPad->Modified();
        gPad->Update();

        testCanvas->cd(3);
        TGraphErrors* graph_pad3 = ((TGraphErrors*)(graph_pad1->DrawClone("AP")));
        graph_pad3->GetXaxis()->SetRangeUser(13,16);
        gPad->Modified();
        gPad->Update();
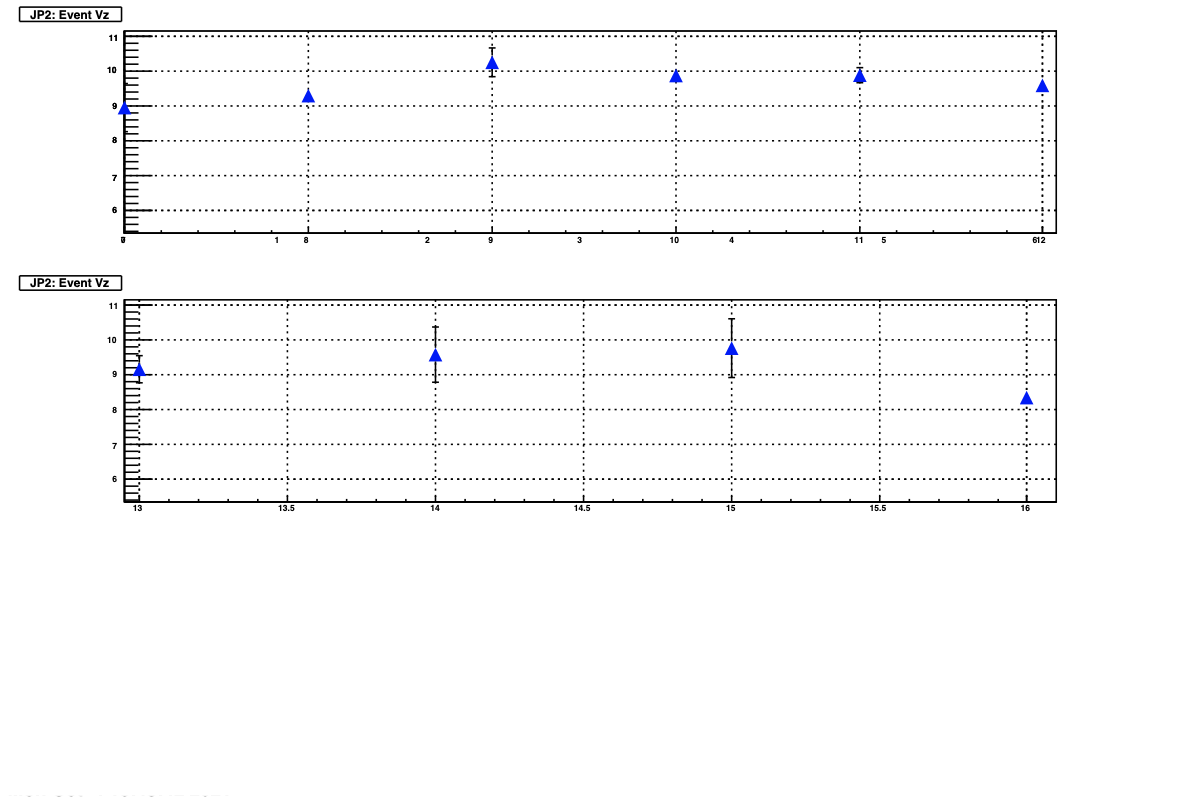
However, the output ends up being the first two pads plotted on top of each other where only the first pad should go, the third pad is plotted in the spot where the second pad should go, and the spot for the third pad is left empty. Please have a look at the following output:
Can you please help me understand what I am doing wrong?