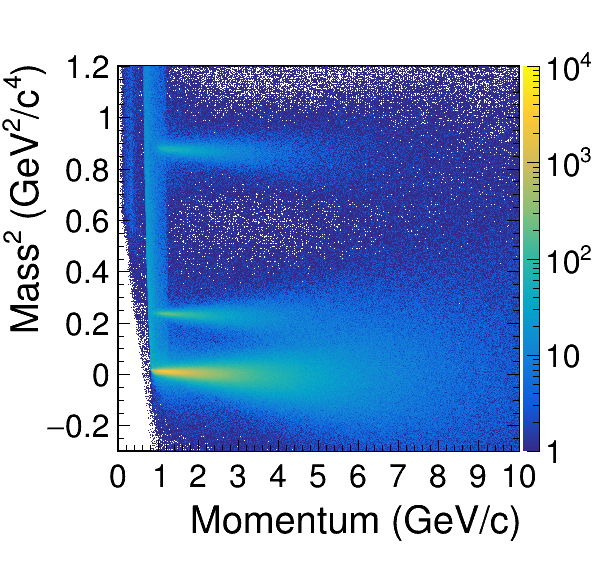
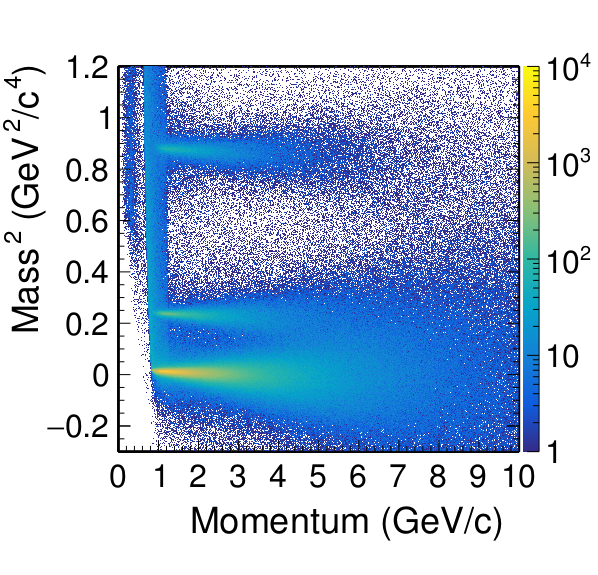
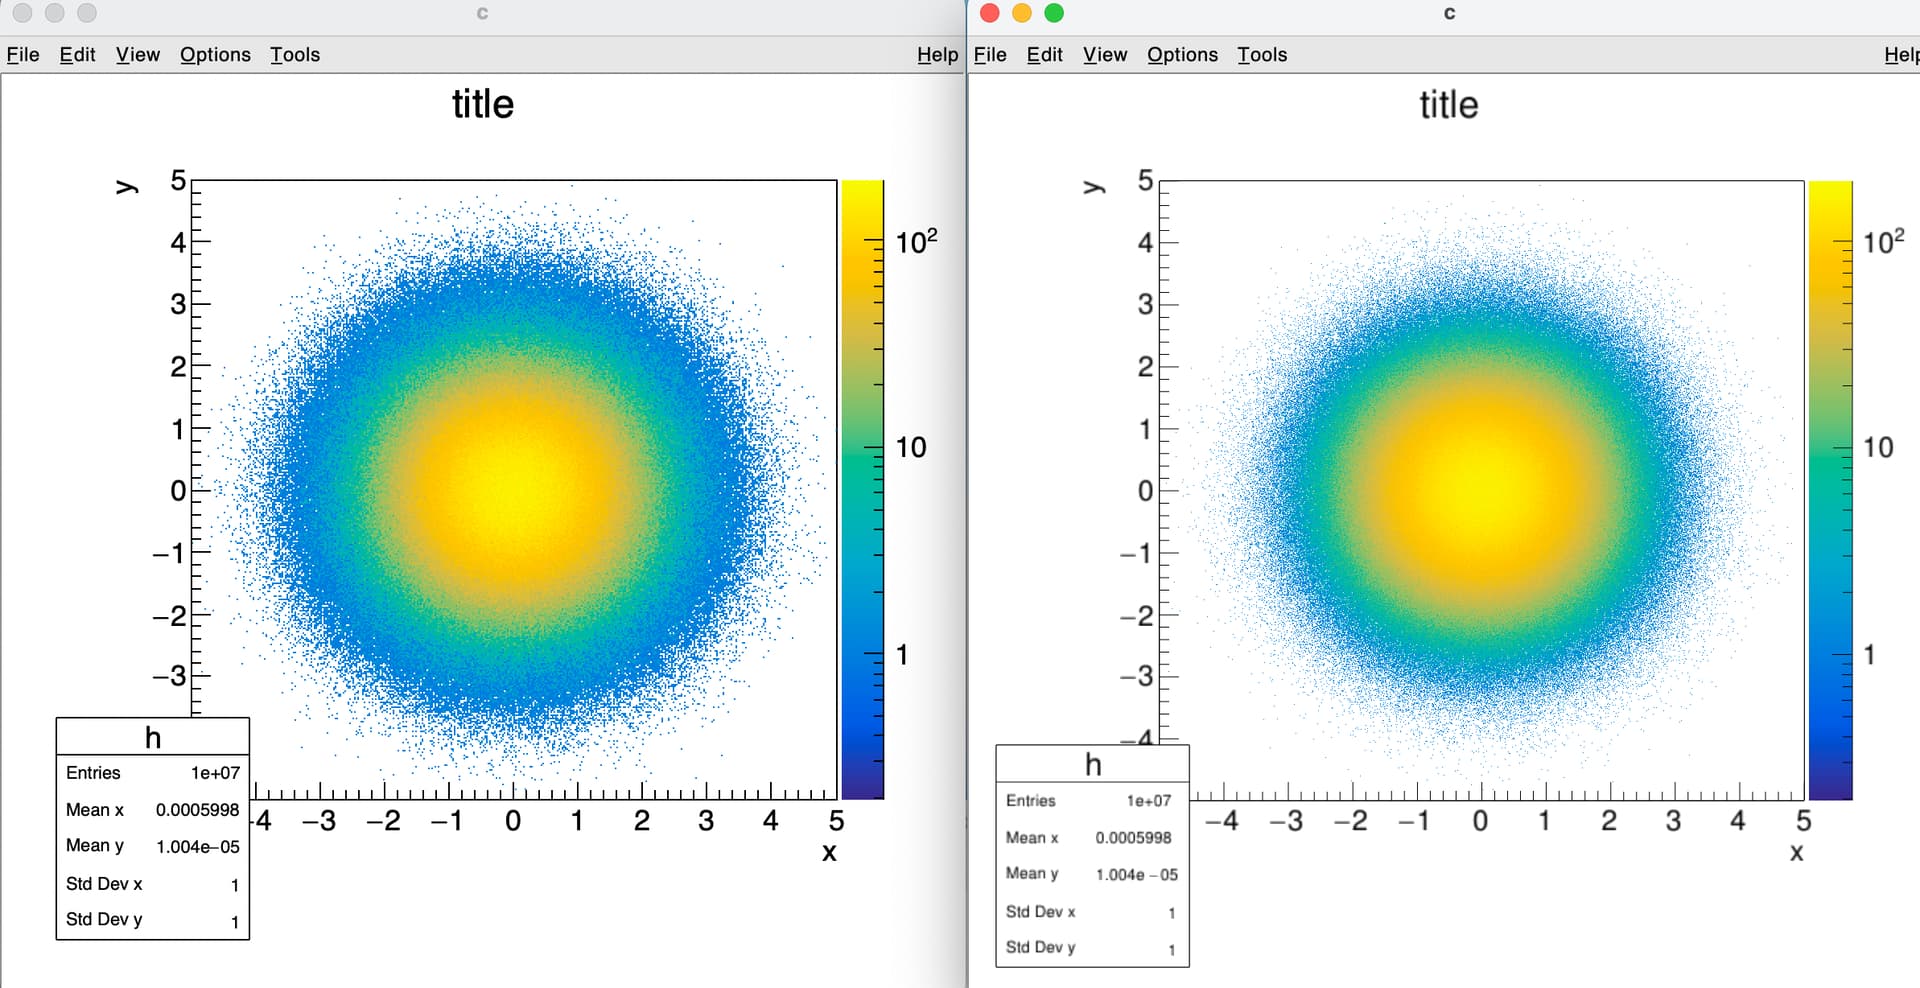
I have tried newer versions of ROOT, and it looks like the plot is on the right.
Looking at this difference, I cannot switch to a newer version of ROOT graphics and keep all my plots consistent with the ones created with the previous ROOT version created with identical data…
EDIT:
I’ve updated the plots. I still had some style setup in the .rootlogon.C.
I’ve commented .rootlogon.C to completely reset the style to the default.
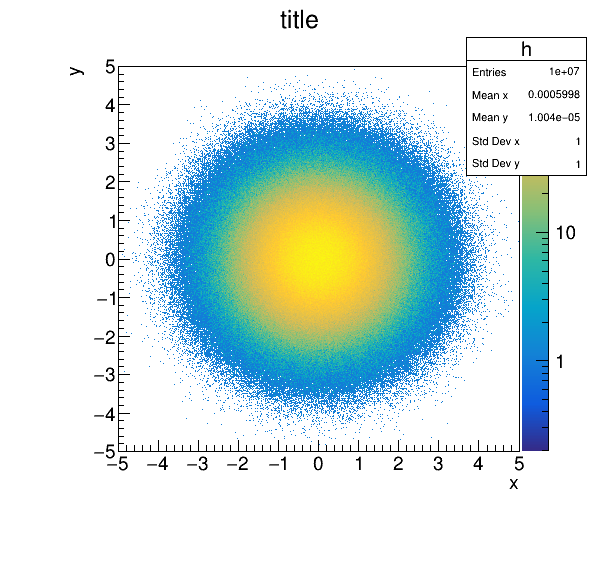
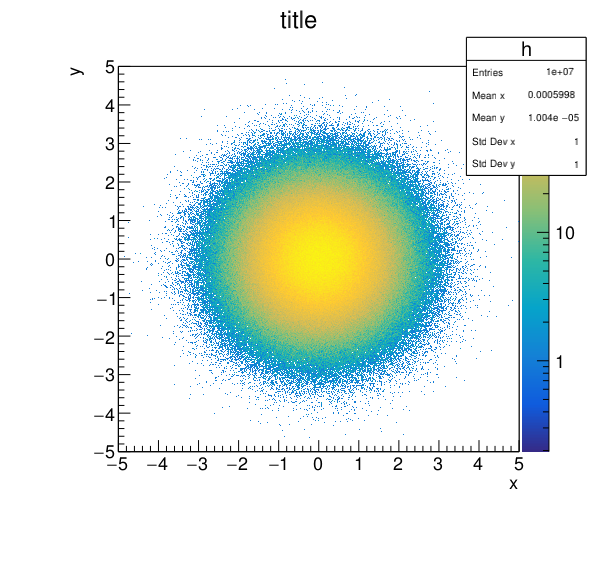
The two plots do look the same. If we turn off the log scale it is also visible. I do not have an answer yet but I suspect something connected to the number of bins of your histogram:
Your cannas size is 600x600
Your histogram has 1000x1000 bins.
As your histogram does not cover the full canvas it means you are trying to represent 2 bins per pixel ! as you can imagine that’s not really feasible, and it is not really surprising that two different graphics backends do not produce exactly the same outputs (because of rounding etc).
On linux, with ROOT 6.30/04 I also get different results with and without GL if the canvas is saved as PNG (and I suppose other raster formats), but saving as PDF both versions look the same. So it appears to be a ‘scaling’ issue indeed (more bins than pixels).
With the latest development version (6.31/01), even the PNG versions look the same, so this seems changed for next releases.
When you go to PDF the same backend is use in both cases. That’s why you get the same picture.
I get the different image on screen on Mac ith master. As I said, with 2 bin per pixel it is hard to predict what will hapend if the backbend are different.