I am creating a PDF that’s a sum of a Gaussian and a Landau with a fraction f applied to the Landau:
wks->factory(“Gaussian::gausSIG(Mjj,mGSIG[38.32,38.092,38.548],wGSIG[7.0,0,16])”); //Create Gaussian with mean and width [init, min, max]
wks->factory(“Landau ::landSIG(Mjj,mLSIG[82,43,121],wLSIG[100,0,400])”);
wks->factory(“SUM::pdfSIG(gausSIG,fSIG[0.70612,0.693,0.719]*landSIG)”);
Then I fit the data and get back the fit values for means, widths and f:
 RooFitResult *fr = wks->pdf("pdfSIG")->fitTo(*wks->data("totalDataSet"+signal),RooFit::Save()); //Fit to preselected data
  fr->Print("v");
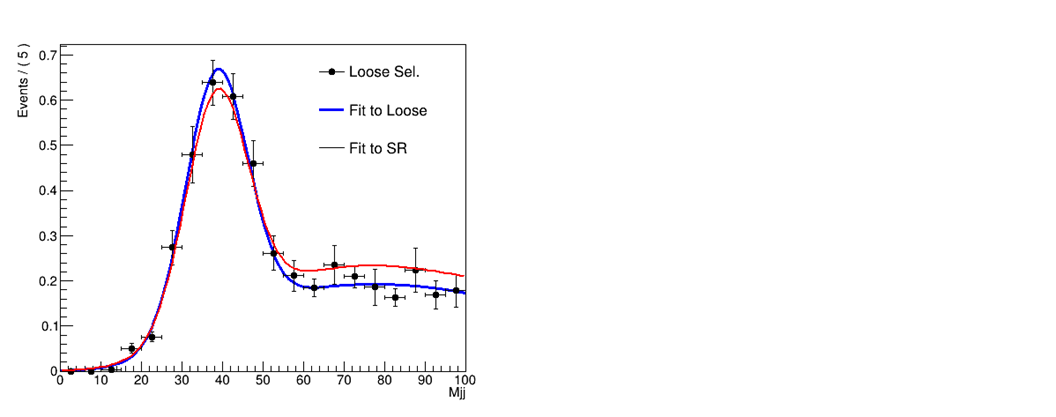
The data and the fit are plotted:
wks->data(“totalDataSet”+signal)->plotOn(plotT,RooFit::DataError(RooAbsData::SumW2));
wks->pdf(“pdfSIG”)->plotOn(plotT,RooFit::Name(“totalFit”));
But if I take the fit values from the print statement above and try to recreate the Gassian+Landau:
  TF1 f6("f6","[6]*([0]*TMath::Landau(x,[1],[2])+[3]*TMath::Gaus(x,[4],[5]))",0,100);
  f6.SetParameters(0.719,83.207,28.335, 0.281,38.548,7.6509,1.8);
(the 1.8 is a guess at the overall norm factor)
I get the red curve in this figure (the blue is the output of the fit). The Gaussian is low and the Landau is high, so it’s not the norm factor.
Any suggestions would be appreciated.