kbat
1
Hello,
I have a TGraphErrors object which contains 6 points. However, when I draw it and set double logarithmic scale:
gr->Draw("ap");
gPad->SetLogx();
gPad->SetLogy();
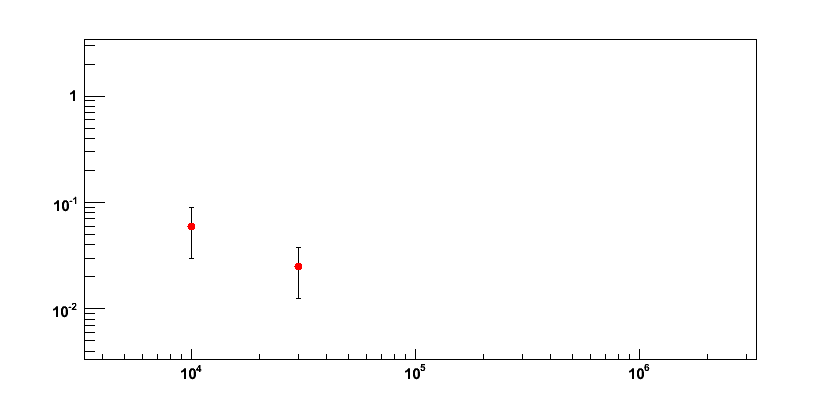
Only 2 points instead of 6 are visible. Why I don’t see others?
The graph and the picture I get are attached.
My ROOT version is 5.17/03.
graph.root (4.02 KB)
couet
2
It seems your graph has points at x=0 and y=0 that is why they disapear in log scale. (log(0) is not valid).
kbat
3
That is not the case:
root [2] gr->Print()
x[0]=200, y[0]=2.0271, ex[0]=0, ey[0]=1.04109
x[1]=400, y[1]=1.00335, ex[1]=0, ey[1]=0.505034
x[2]=1000, y[2]=0.500417, ex[2]=0, ey[2]=0.250626
x[3]=10000, y[3]=0.0600007, ex[3]=0, ey[3]=0.0300011
x[4]=30000, y[4]=0.0250001, ex[4]=0, ey[4]=0.0125001
x[5]=3e+06, y[5]=0.0005, ex[5]=0, ey[5]=0.00025
couet
4
ok, I’ll have a closer look.
kbat
5
Of course, one can adjust the limits of both axes manually, but I’d like them to be in the proper values automatically.
couet
6
If I execute the following macro it works. I get the attached plot:
void grapherrorslog()
{
   TFile f("grapherrors.root");
   gr->Draw("ap");
   gPad->SetLogx();
   gPad->SetLogy();
}
only when I run the same commands interactively I get the problem you described…
I am investigating.
couet
7
adding gPad->Update(); after gr->Draw(“ap”); in the macro, produces also the problem.
kbat
8
Exactly! That was the cause of the problem in my case. I removed gPad->Update() and it helped. Of course, that would be great to get rid of this bug.
couet
9
This is now fixed in the SVN trunk.