Hello everyone,
I’m an italian student and I’ve been working on a lot of data for my thesis in physics, using ROOT to plot histograms and graphs: I’ll get to the point straight ahead.
My source code, a single .cpp file, looked kind of like this:
#include < all the libraries i need >
< declaration of the various functions, with all the instructions >
int main ()
{
     TH1F h1 = ( ... );
     TH2F h2 = (  "", "", nBins, -range1, range1, nBins, -range2, range2 );
     // fill histograms here
     while ( things happen )
     {
          h1.Fill( v[i] );
          h2.Fill( v[i], w[i] );
          i++;
     }
     < print histograms here >;
     return 0;
}
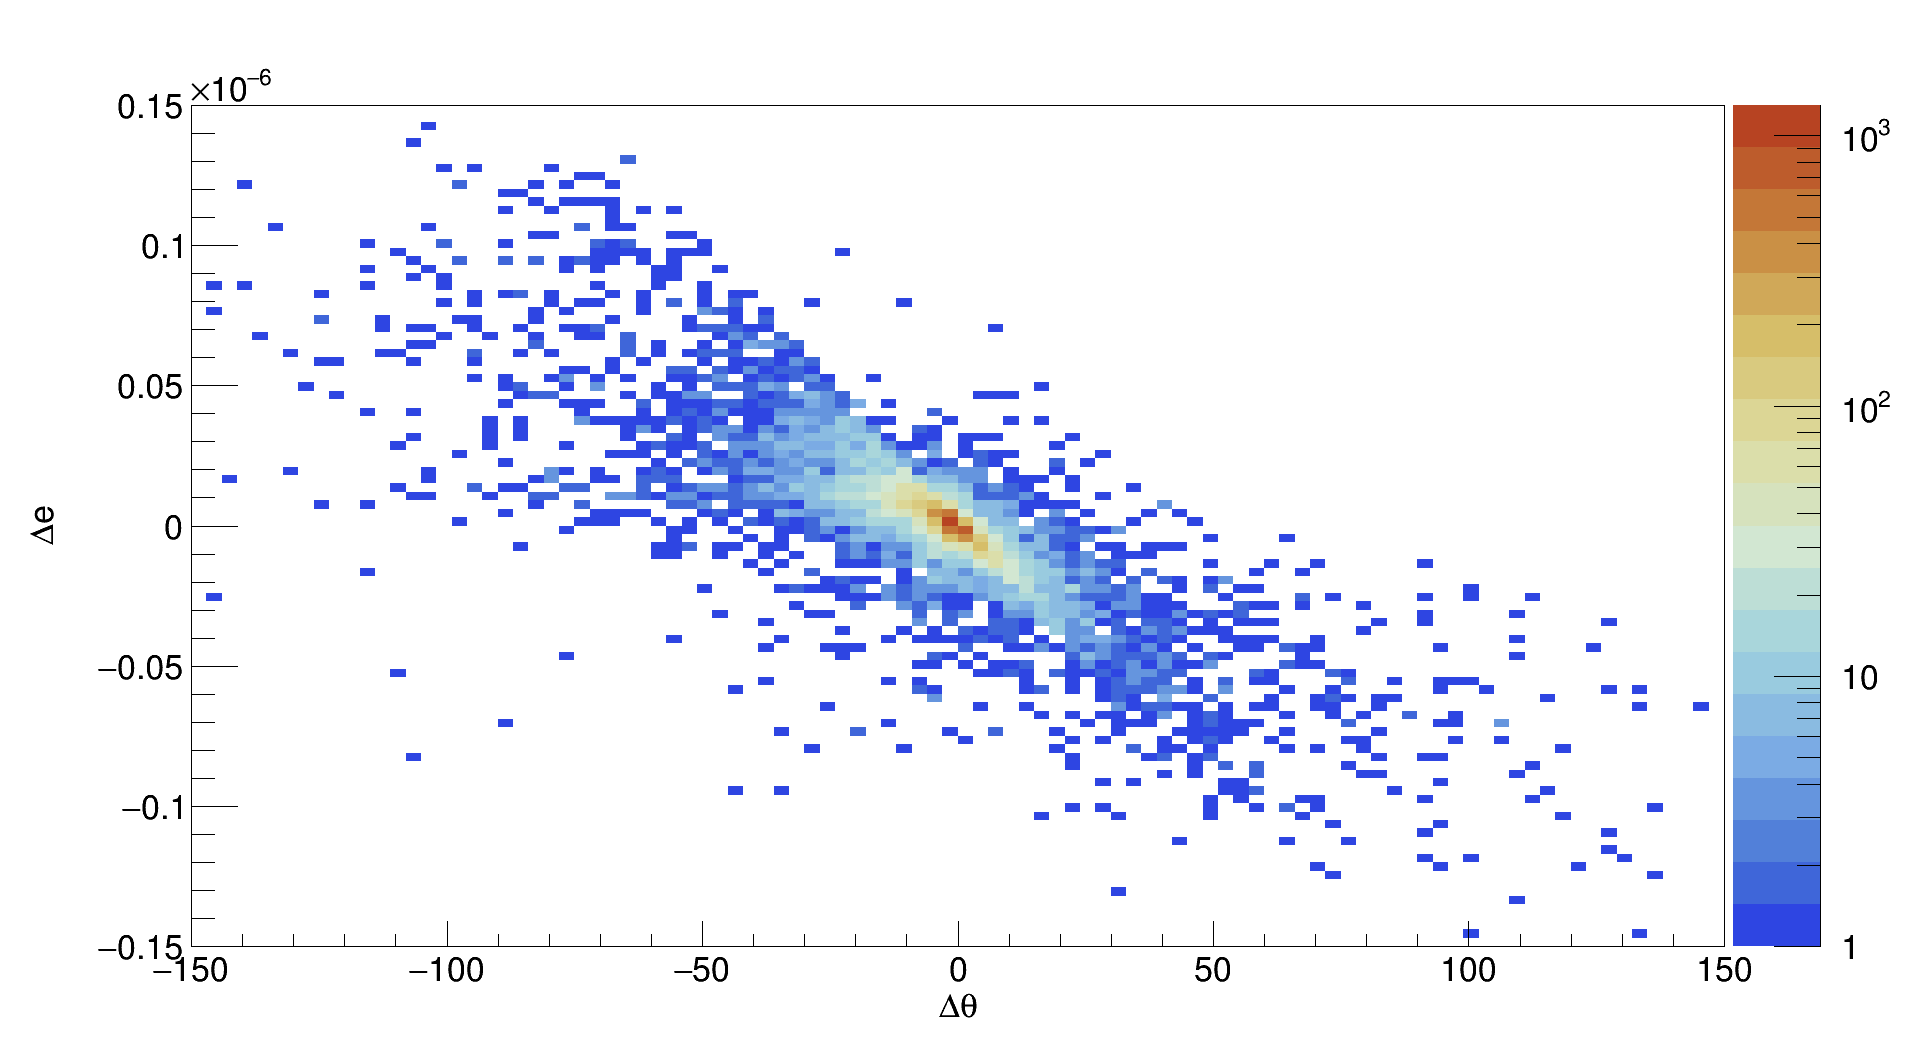
Everything was fine, and I could correctly plot the scatterplot I needed to show a correlation between two variables. Here’s a draft.
Having made lots of custom functions for data analysis, I have decided to split my code into three different parts:
1- header file: functions.h -> names of the functions and all c++ and ROOT libraries are declared here.
2- functions.cpp: what the various functions do appears here + #include “functions.h” on top
3- main.cpp: no need to explain this, nothing changed here + #include “functions.h” on top
The code is compiled correctly.
Now, my source code looks quite like this:
#include "functions.h"

int main ()     // nothing changed here
{
      TH1F h1 = ( ... );
      TH2F h2 = (  "", "", nBins, -range1, range1, nBins, -range2, range2 );
     // fill histograms here
     while ( things happen )
     {
          h1.Fill( v[i] );
          h2.Fill( v[i], w[i] );
          i++;
     }
     < print histograms here >;
     return 0;
}
And now, apparently for no reason at all, h2 is printed empty. The axis range is plotted correctly, I just don’t understand why on earth h2 pleases me with all this emptiness. h1 is always printed correctly, by the way. Both libraries ( “TH1F.h” and “TH2F.h” ) are included in the same file ( functions.h ), and no errors appear when I compile my code.
Fun part in this absurdity: if, for example, I “tell” h2 to fill the bin corresponding to the coordinates (0., 0.) ten thousand times, the histogram is printed correctly, with te thousand entries in ( 0., 0. ) - If I manually edit range1 and range2 ( see picture ) and fill the histogram with my actual data, h2 is either printed empty or in a completely wrong way. ( New users can only post one image in a post, sorry >__> )
Does anyone know why this is happening? I really don’t know what to do to fix this issue and I could use some help >__>
( Of course I can just merge my files and ignore the issue, but my code was just too messy to deal with and I wouldn’t want to do that. Free bug report, I guess?  )
)
Thank you for your help,
Freddy
ROOT Version: 6.18.04
Platform: Ubuntu 18.04 on Windows for Developers ( + Xming )
Compiler: No idea, I have been taught to type " c++ -o program main.cpp ‘root-config --cflags --glibs’ " in my terminal and it works
