Hi all,
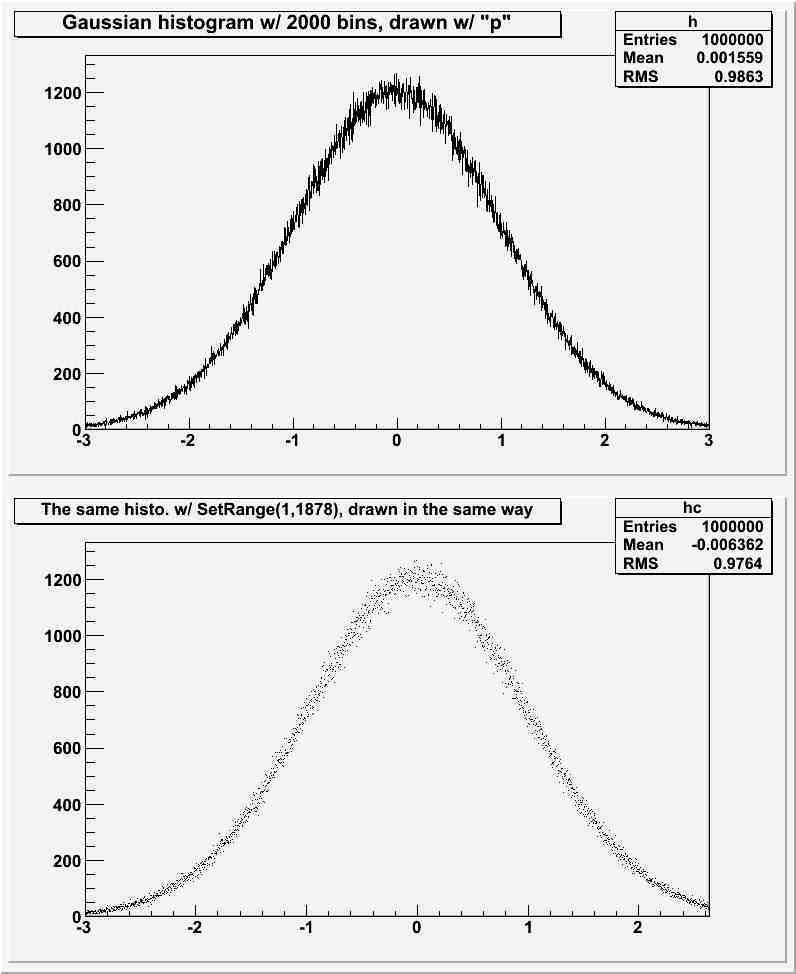
To Draw() histograms w/ thousands of bins with markers (i.e., with the “p” option), I have to limit the number of bins displayed to <=1878…
Why?
Thanks in advance…
Kazuyoshipoints.C (397 Bytes)
Hi all,
To Draw() histograms w/ thousands of bins with markers (i.e., with the “p” option), I have to limit the number of bins displayed to <=1878…
Why?
Thanks in advance…
Kazuyoshipoints.C (397 Bytes)
[quote=“furutaka”]Hi all,
To Draw() histograms w/ thousands of bins with markers (i.e., with the “p” option), I have to limit the number of bins displayed to <=1878…
Why?
Thanks in advance…
Kazuyoshipoints.C[/quote]
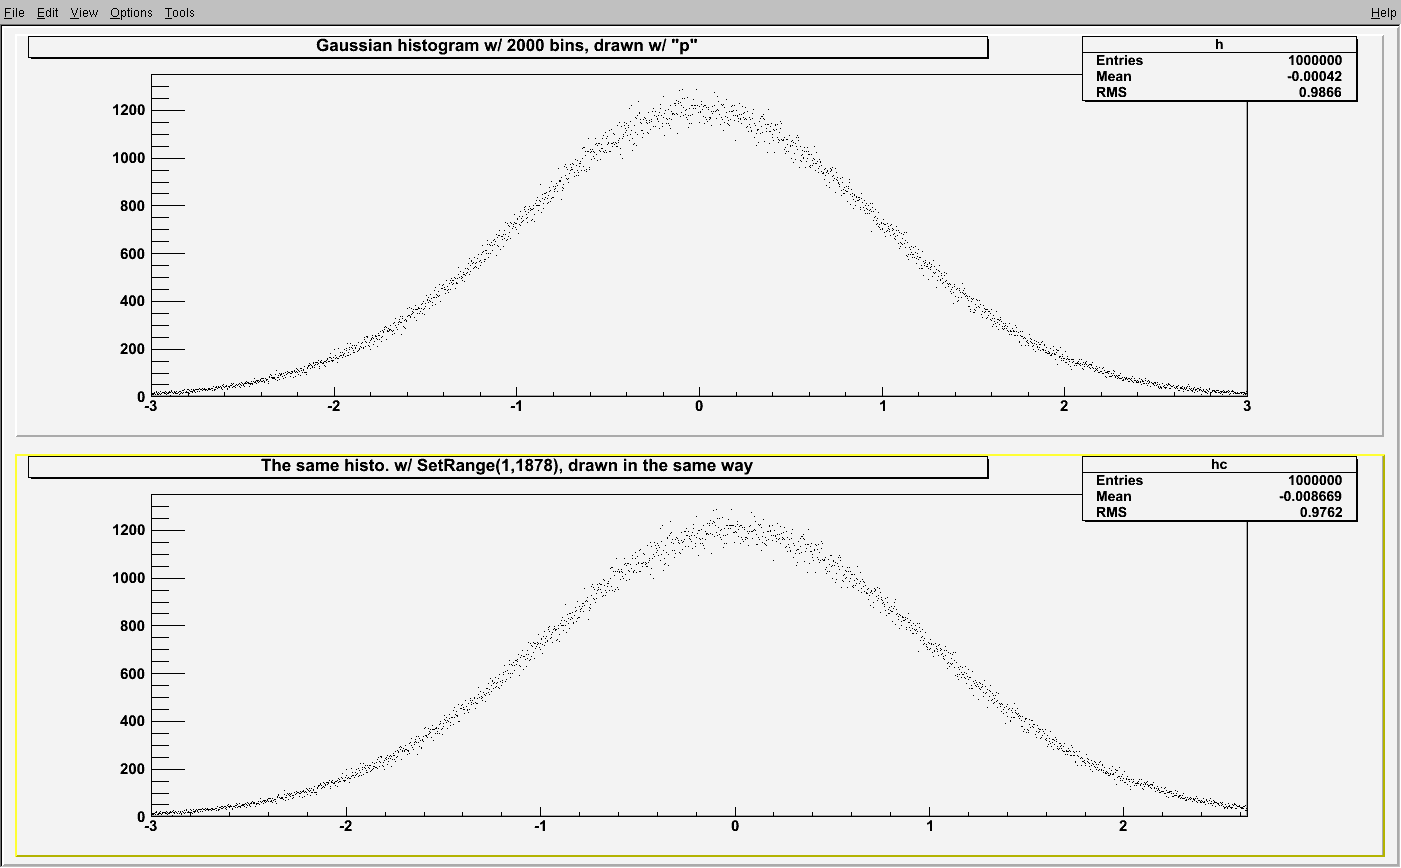
Hmmm, I think this magic number is not important, but big number of bins is. I’ve tried to resize the canvas window with mouse and got the picture attached. If I shrink canvas back, the picture will become like yours.
Your window along the X axis has 800 pixels. Your histogram has 2000 bins. It means you have 3 bins per pixels ! In a such case a simplified drawing algorithm is performed because, with lines or markers, it will be in any case the same…
Ah, I see… (sigh)
Thanks, Couet and tpochep.
Kazuyoshi
Well, thanks to the TGraph::TGraph(const TH1* h) constructor, I could easily draw the desired plots with markers with TGraph.
Kazuyoshi