I am trying to use the functionality of drawing candle plots from a TTree, but it seems I do not understand how they work.
My expectation:
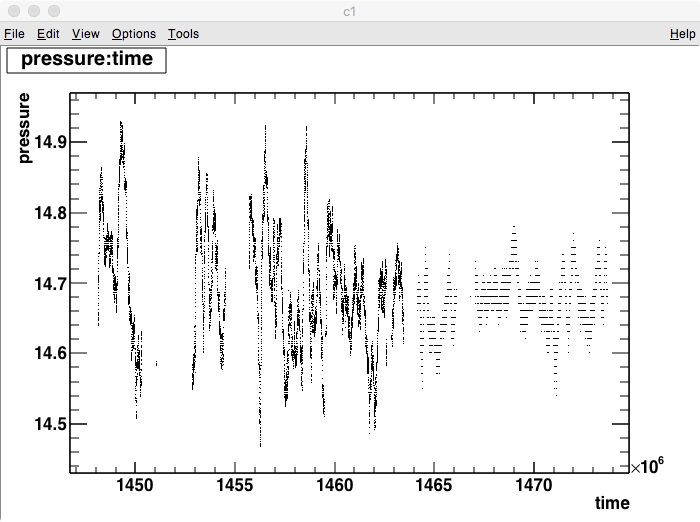
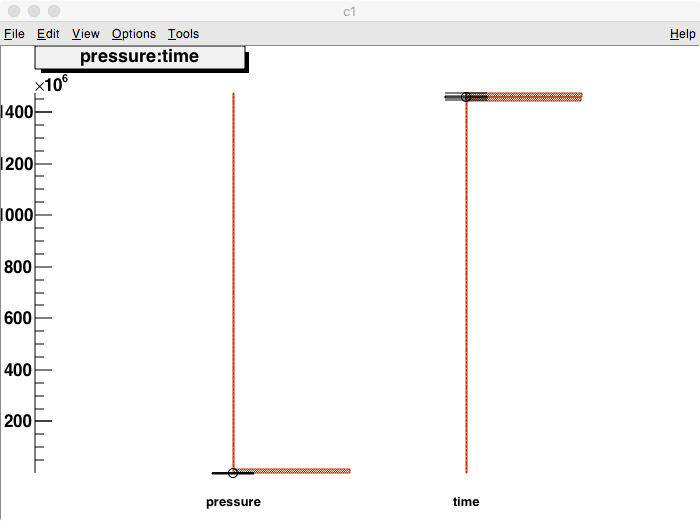
If you TTree::Draw(“y:x”,"",“candle”), this will bin the x and y data, but instead of making a normal TH2D, each x-bin will have a candle showing the statistics of the y coordinates for the points in that bin. So if I specify 10 x bins, I should get 10 vertical candles laid out side-by-side showing the ranges/quartiles and such of the y values.
What ROOT is giving me:
I don’t really know. It seems to put the x values on a vertical axis, draws TWO candles, one for “y” and one for “x”. The drawing/framing is also messed up, it doesn’t seem to fit on the pad.
Attached are two screenshots of what I get when I do these two (pyroot) commands:
The Candle option in TTree::Draw() draws one candle for each variable you entered in the draw command. Like the parallel coordinates this allows to produce plot with any number of variable. Data are not binned in that case and each candle reflect correctly the distribution of each variable. What you request here is to draw a 2D histogram as candle plot. For that simply fill the 2D histogram from the tree and then draw it using the candle option as explained here:
Ah I think I was confused by old forum posts that say you can only do candlesticks directly from TTree::Draw commands. Thanks.
Is there a way to make a range of candlesticks along X (and thus binning X) while keeping the Y values unbinned for calculating the candlesticks? For now I will use a large number of Y bins.
When not drawn from trees,cCandle sticks are drawn from 2D histograms. Therefore both axis are binned. For a given histogram you can choose to draw the candles along X or along Y (see the doc).