Is it possible to plot Candlestick charts in ROOT? I was going through the documentation of CANDLE Draw option but it looks like it is different from the candlestick I’m looking for. I have a set of data composed by an analogous form of First Quartile (Open/Close), Third Quartile (Open/Close), Minimum (Low) and Maximum (High) describing each point. Is this function implemented? Or is there a way to use CANDLE option to do these charts?
Just to clarify, it sounds to me as if @amvargash already has the statistics computed from his data set and wants to plot the candlestick plot without the original distribution.
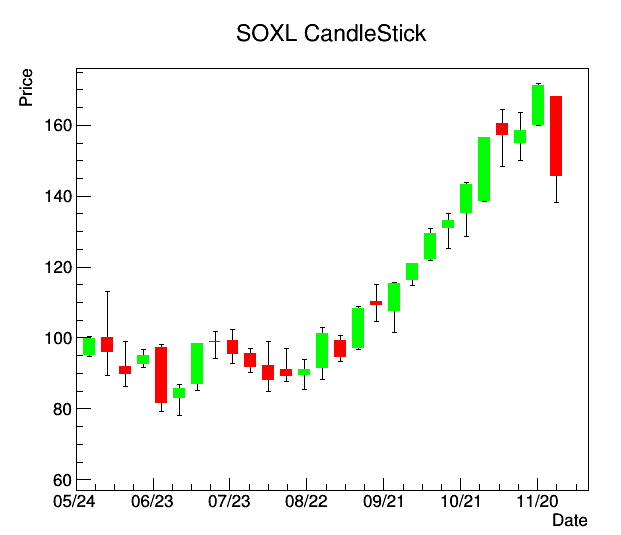
@nehcuh For the one I mentioned, there is some code available here https://github.com/vargasa/StockDataAnalysis/ I’m no t sure if the data downloading still works but probably you can reuse and adapt some of the code