tl;dr: Suppose you have multiple y values for the same x value in a TTree. Is there a way to get a CANDLE/VIOLIN of the y values at each x using TTree::Draw("y:x")?
Since TTree::Draw("y:x") creates a TGraph, the answer is “No” because a TGraph cannot be drawn as a CANDLE/VIOLIN. In fact, the output of TTree::Draw("y:x","","CANDLE") is two candles, one for y values and one for x values, which makes some sense.
OTOH, I was expecting TTree::Draw("y:x>>h(100,0,100,10,0,10)","","VIOLIN") to do the trick, since there is an histogramming step. Alas, that is not the case, even if the axes ranges now comply to the histogram specification.
That said, an ensuing gDirectory->Get("h")->Draw("CANDLE") works like a charm, so not all is lost.
So, all in all, I was wondering if this is all expected behaviour and if I am going about it in the most efficient way.
Yes, a TH2 is created, but it is not displayed; what is displayed is the TGraph (with the axes of the histogram…) Perhaps I was not clear when writing my original post?
I think that my question can be phrased as:
Is it consistent/expected/intuitive that TTree::Draw(“y:x>>h”)displays a TGraph instead of the created TH2?
You cannot mean “ROOT generates […]” because that is falsified by the example I posted.
If you mean “The user should generate […]” then I still do not understand the logic through which TTree::Draw("y:x","","BOX") uses THistPainter (as you pointed out) but TTree::Draw("y:x","","VIOLIN") uses TGraphPainter.
Thank you for engaging. Unfortunately, all the aspects mentioned were already known from the outset.
I would appreciate a direct and clear answer to whether TTree::Draw("y:x","","VIOLIN") was meant to be displayed as a TGraph or if this line of code, instead of
if (opt.Contains("candle")) optcandle = kTRUE;
should be
if (opt.Contains("candle") || opt.Contains("violin")) optcandle = kTRUE;
May be I was not clear enough. Let me try to explain better.
There is two different options CANDLE, one for 2D histograms and one for trees/ntuples.
The later is based on the same mechanism as the parallel coordinates, in the sense you get one candle per variable you draw like you get one axis per variable with parallel coordinates.
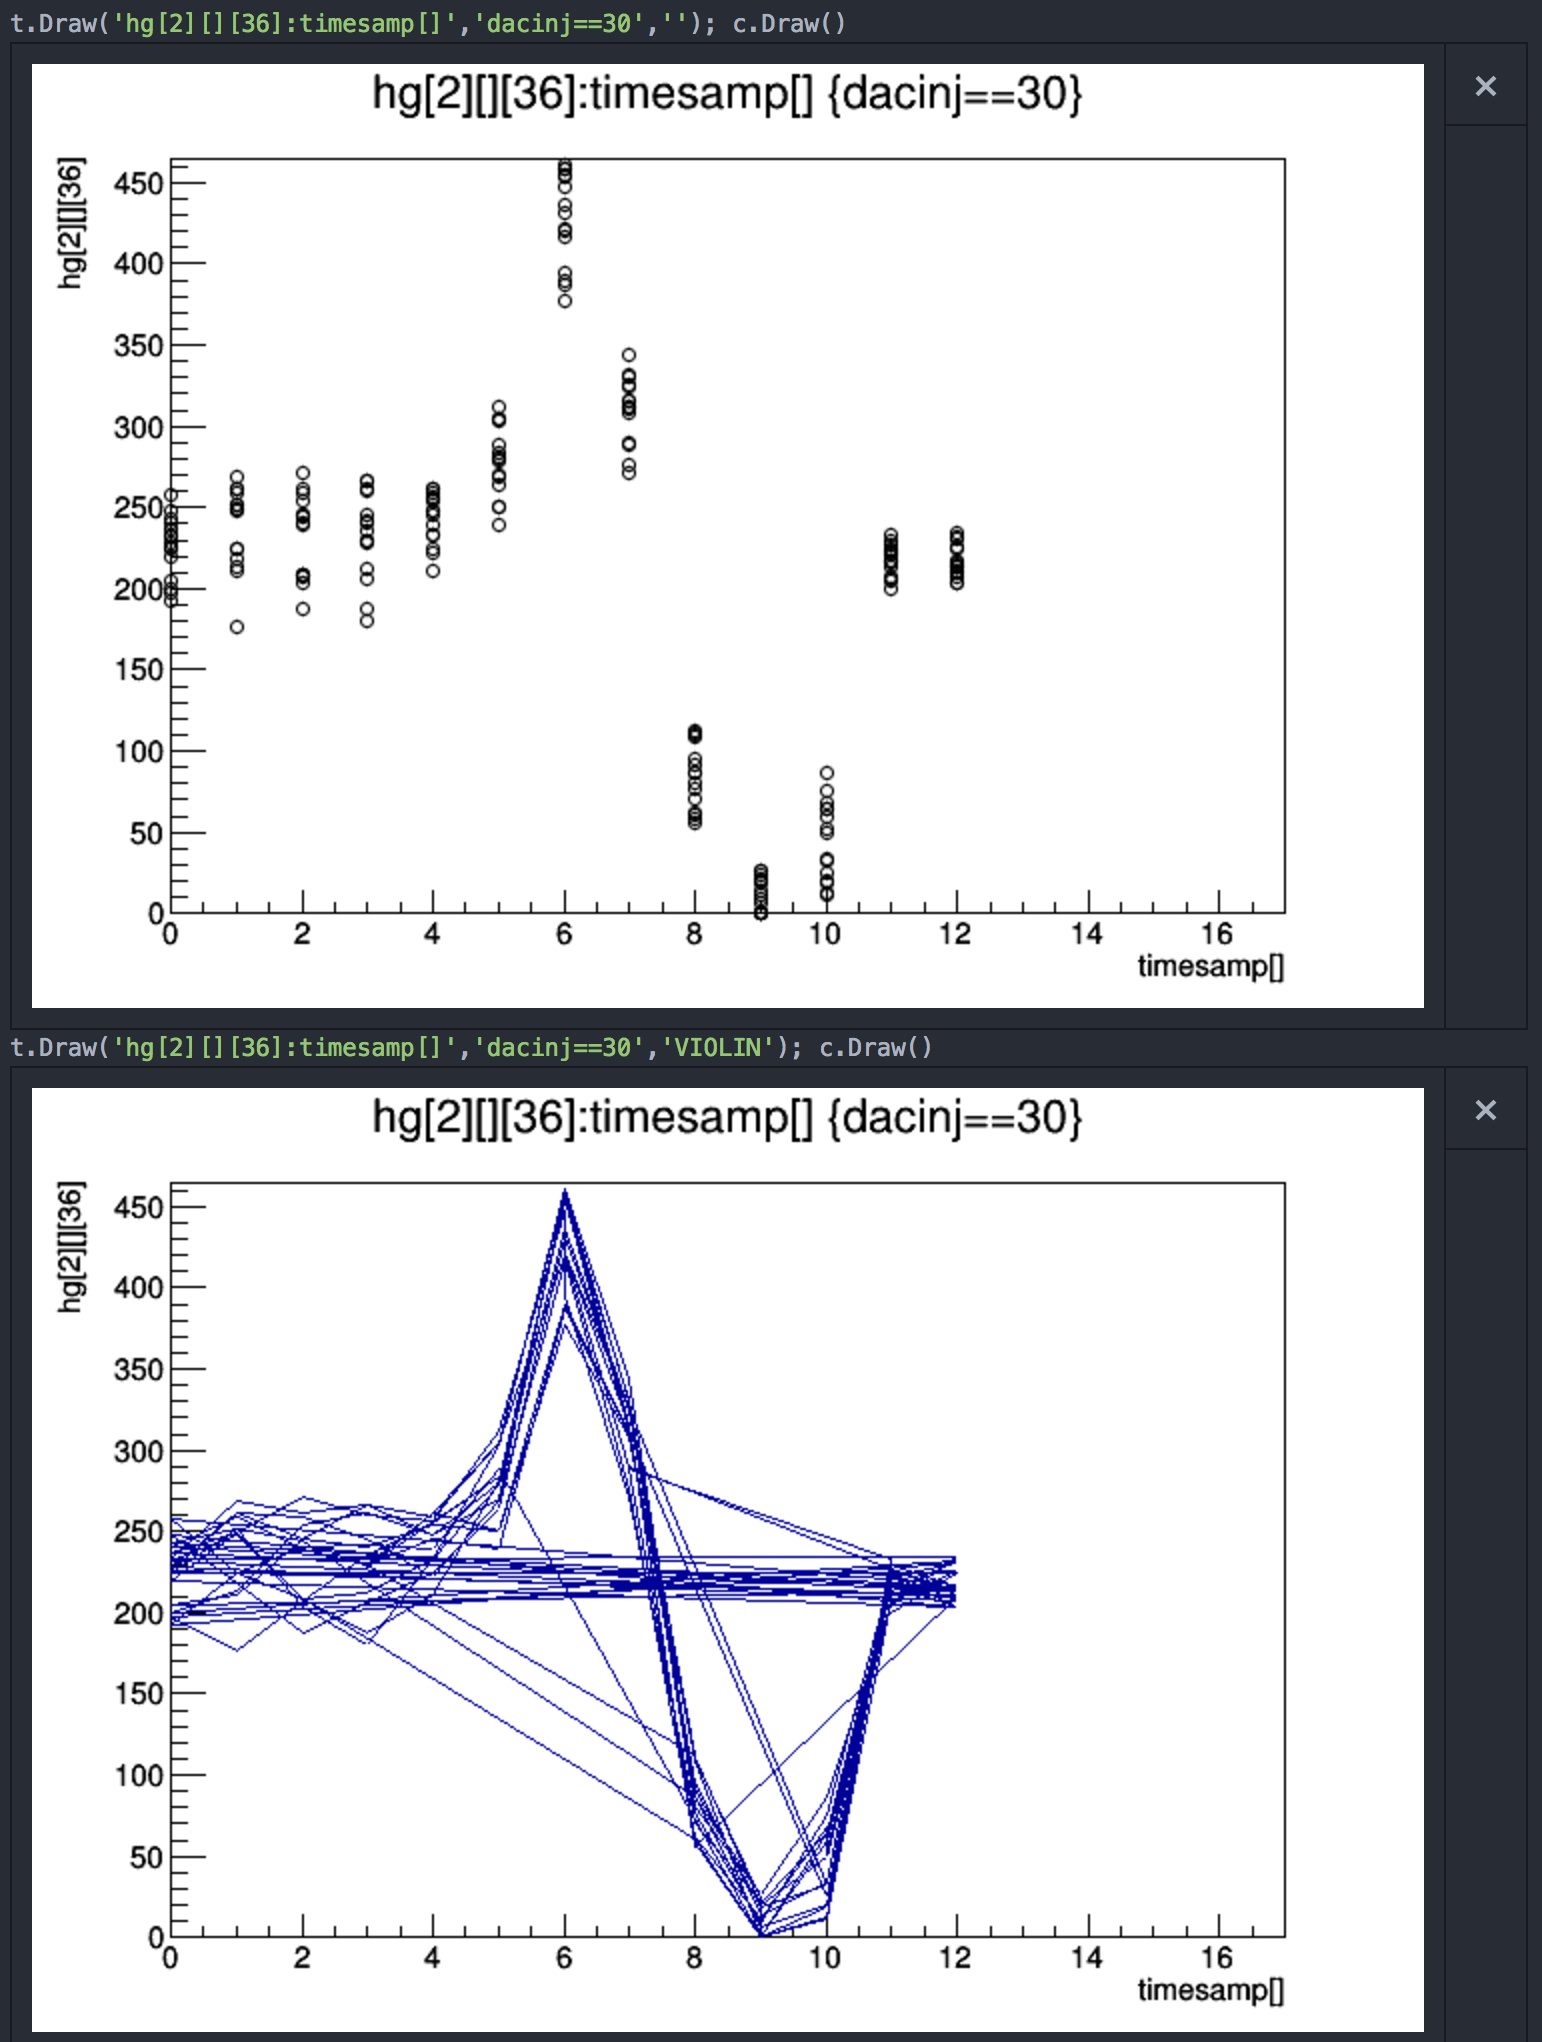
The option VIOLIN is a “friend option” of the CANDLE option for histograms. It is valid for 2D histograms only. When you pass it to TTree::Draw it is not interpreted. Only the “L” of VIOLIN is seen, which explains the line plot you get.
So if you want to get a VIOLIN plot from the 2D histogram produced by the TTree::Draw() command, you should proceed as I described previously.
For curiosity I applied the patch you suggested in TTreePlayer. All I get is a ROOT crash.