Crisps
July 18, 2024, 5:43am
1
Dear experts
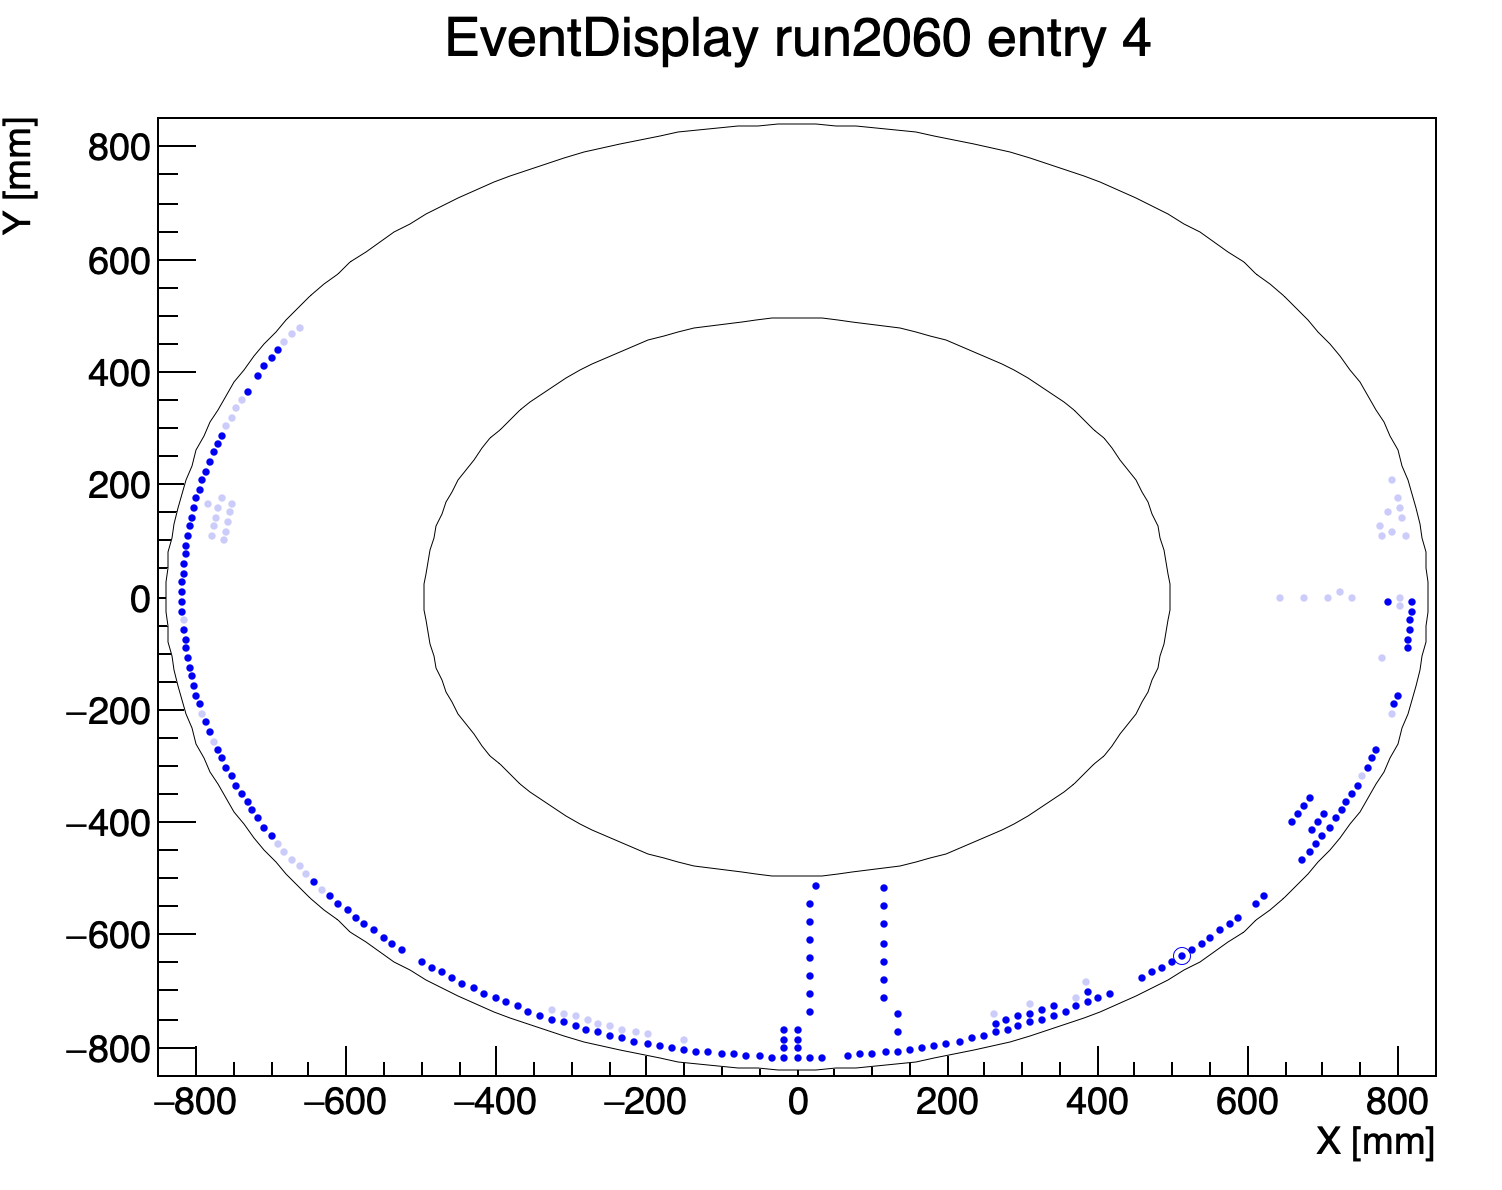
I made a GUI to show waveform when the mouse is moving on the TGraph (event display), and I made 2 TGraph where the first one contains points that are not filtered, the second contains points that are filtered. Here is what I wrote:
//draw other things above
g1->SetMarkerColor(kBlue);
g2->SetMarkerColor(kBlue - 10);
g1->Draw("PSAME");
g2->Draw("PSAME");
g1->SetHighlight();
g2->SetHighlight();
I found that it’s nearly impossible to move my mouse on the points of the second TGraph, where the points on the first TGraph are very easy to be highlighted.g2->SetHighlight(); g1->SetHighlight() this time the g1 becomes nearly impossible to be highlighted. How can I solve this?TGraph
Danilo
July 18, 2024, 8:16am
2
Hi,
Nice.@couet @bellenot @linev )
Cheers,
couet
July 22, 2024, 1:10pm
4
Can you send a small macro reproducing the problem?
Crisps
July 22, 2024, 1:41pm
5
void test(){
        TCanvas* c = new TCanvas();
        TGraph* g1 = new TGraph();
        TGraph* g2 = new TGraph();
        for(int i=0; i<50; ++i){
                for(int j = 0; j< 10; ++j){
                        double x1 = i;
                        double x2 = i + 0.5;
                        double y1 = j * 5;
                        double y2 = j * 5+ 3;
                        g1->AddPoint(x1, y1);
                        g2->AddPoint(x2, y2);
                }
        }
        g1->SetMarkerStyle(20);
        g2->SetMarkerStyle(20);
        g1->SetMarkerSize(0.4);
        g2->SetMarkerSize(0.4);
        g1->SetMarkerColor(kRed);
        g1->SetMarkerColor(kBlue);
        TH1F* frame = gPad->DrawFrame(0., 0., 50., 50.);
        frame->SetTitle("EventDisplay" );
        frame->GetXaxis()->SetTitle("X [mm]");
        frame->GetYaxis()->SetTitle("Y [mm]");
        TLine* l = new TLine(0, 25, 50, 25);
        g1->Draw("P");
        g2->Draw("P");
        g1->SetHighlight();
        g2->SetHighlight();
}
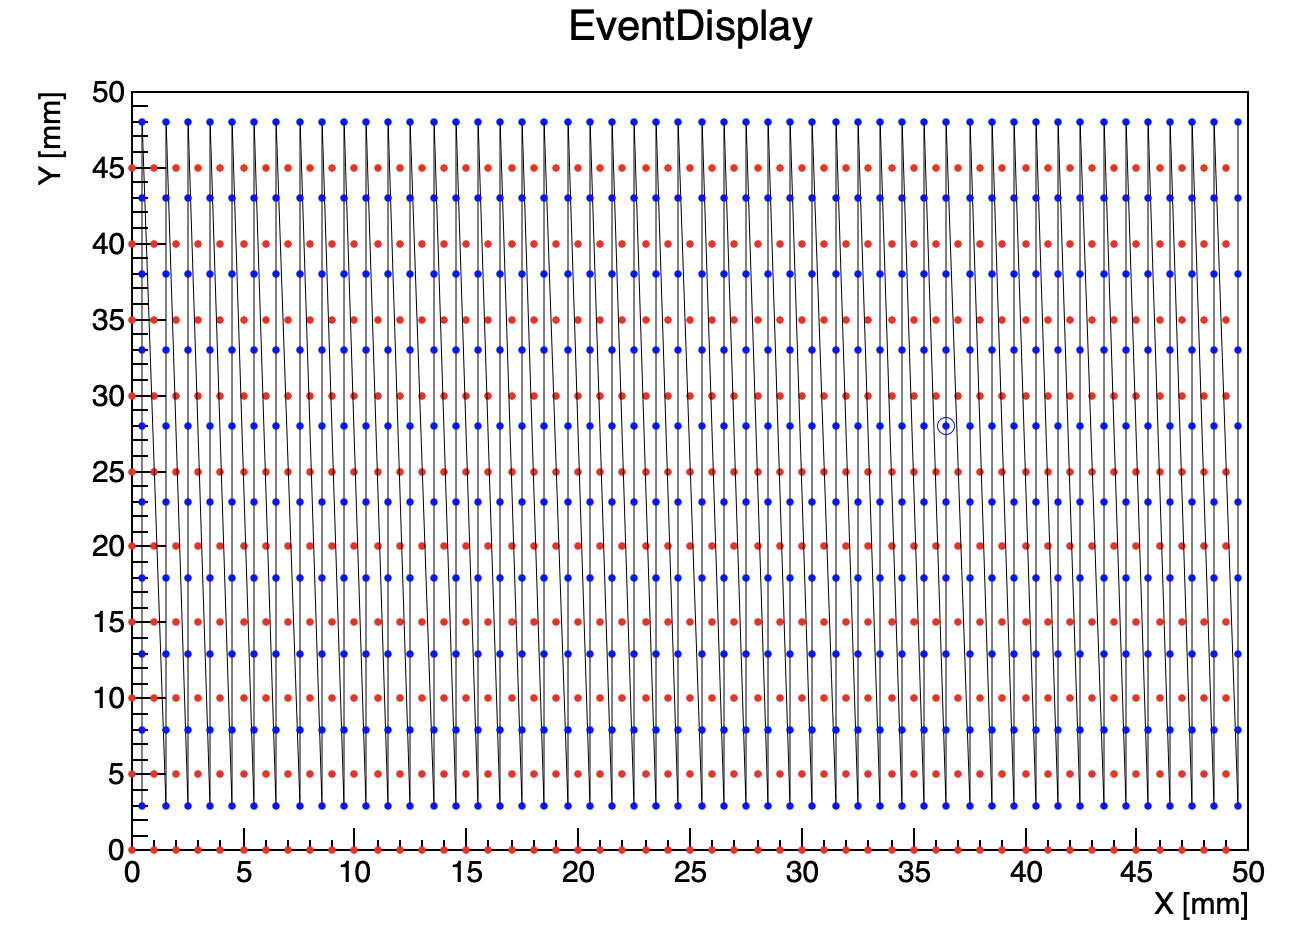
I found that g2 points that near Y=[15, 35] are hard to be highlighted.
couet
July 22, 2024, 1:55pm
6
I modified slightly your macro by adding the option L on the 2nd graph:
{
   TCanvas* c = new TCanvas();
   TGraph* g1 = new TGraph();
   TGraph* g2 = new TGraph();
   for(int i=0; i<50; ++i){
      for(int j = 0; j< 10; ++j){
         double x1 = i;
         double x2 = i + 0.5;
         double y1 = j * 5;
         double y2 = j * 5+ 3;
         g1->AddPoint(x1, y1);
         g2->AddPoint(x2, y2);
      }
   }
   g1->SetMarkerStyle(20);
   g2->SetMarkerStyle(20);
   g1->SetMarkerSize(0.4);
   g2->SetMarkerSize(0.4);
   g1->SetMarkerColor(kRed);
   g2->SetMarkerColor(kBlue);
   TH1F* frame = gPad->DrawFrame(0., 0., 50., 50.);
   frame->SetTitle("EventDisplay" );
   frame->GetXaxis()->SetTitle("X [mm]");
   frame->GetYaxis()->SetTitle("Y [mm]");
   TLine* l = new TLine(0, 25, 50, 25);
   g1->Draw("P");
   g2->Draw("PL");
}
As you can wee th plot because very crowded. The lines obscure the 1st plot. When you interact with a graph there is two way to manipulate it:
you click on a point they and hand is disokayed and ou can move that point
you click on a the line between 2 points (even if not displayed) then you can move the whole graph.
These two interaction modes are working perfectly with you example. It is just more tricky to pick the graph in the background but not impossible.
couet
July 22, 2024, 1:59pm
7
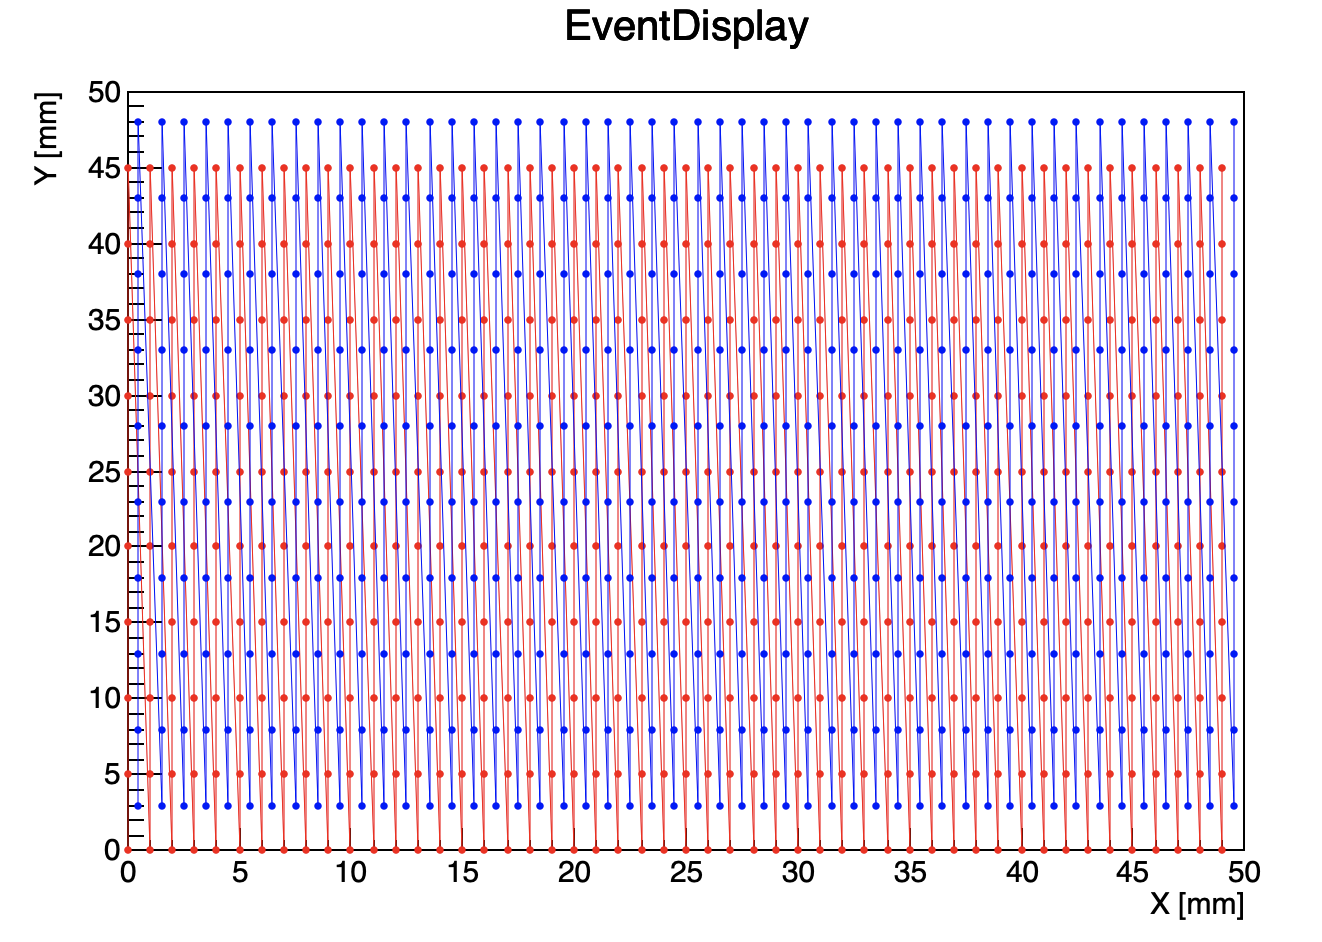
And if you draw both graphs with lines you see even better what I am taling about:
Crisps
July 22, 2024, 2:25pm
8
Yes, I can confirm that when I can not highlight the point it’s because the mouse is trying to move the graph (cursor changed to moving mode, becomes arrows)
couet
July 22, 2024, 2:29pm
9
No, there is no way to disable the lines picking. It is hardcoded here:
             }
          }


          ////////////////////////////////////////////////////////////////////////////////
          /// Compute distance from point px,py to a graph.
          ///
          /// Compute the closest distance of approach from point px,py to this line.
          /// The distance is computed in pixels units.

          Int_t TGraphPainter::DistancetoPrimitiveHelper(TGraph *theGraph, Int_t px, Int_t py)
          {

             // Are we on the axis?
             Int_t distance;
             if (theGraph->GetHistogram()) {
                distance = theGraph->GetHistogram()->DistancetoPrimitive(px,py);
                if (distance <= 5) return distance;
             }

             // Somewhere on the graph points?
Crisps
July 22, 2024, 2:37pm
10
Ah…I see
couet
July 23, 2024, 7:07am
11
Currently, there is no workaround for this issue. If a primitive is behind another, it cannot be accessed using the basic interaction provided by the canvas. In your case, the simplest solution might be to zoom in on the area you want to select so you can clearly differentiate between the two graphs.
ferhue
July 23, 2024, 8:57am
12
This macro solves the job for you:
#include <iostream>
#include "TPolyMarker.h"
#include "TMarker.h"
#include "TCanvas.h"
#include "TPad.h"
#include "TLine.h"
#include "TH1F.h"
#include "TMath.h"
#include "TClass.h"

TPolyMarker* g1 = nullptr;
TPolyMarker* g2 = nullptr;
TMarker* highl = nullptr;

using std::cout, std::endl;

void highlight(Int_t event, Int_t x, Int_t y, TObject *selected)
{
   TCanvas *c = (TCanvas *) gTQSender;
   //~ printf("Canvas %s: event=%d, xp=%d, yp=%d, selected=%s\n", c->GetName(),
          //~ event, x, y, selected->IsA()->GetName());
   const double d1 = g1->DistancetoPrimitive(x,y);
   const double d2 = g2->DistancetoPrimitive(x,y);
   const double d = std::min(d1,d2);
   const double threshold = 10; // in pixels
   if(d >= threshold) {
       delete highl;
       highl = nullptr;
       c->Modified();
       c->Update();
   }
   else
   {
       TPolyMarker* const gh = d1 < d2 ? g1 : g2;
       const Int_t np = gh->Size();
       Double_t * const px = gh->GetX();
       Double_t * const py = gh->GetY();
       Double_t mindist = 1e12;
       Int_t minidx = -1;
       for(Int_t i=0; i<np; ++i)
       {
           const double dist = TMath::Sqrt(TMath::Power(gPad->XtoAbsPixel(gPad->XtoPad(px[i]))-x,2)+TMath::Power(gPad->YtoAbsPixel(gPad->YtoPad(py[i]))-y,2));
           if(dist < mindist)
           {
               mindist = dist;
               minidx = i;
           }
       }
       if(!highl) {
        highl = new TMarker(px[minidx], py[minidx], 24);
        highl->SetBit(kCannotPick);
        highl->SetMarkerColor(gh->GetMarkerColor());
        highl->SetMarkerSize(gh->GetMarkerSize()*2.0);
        highl->Draw();
       }
       else {
           highl->SetMarkerColor(gh->GetMarkerColor());
           highl->SetMarkerSize(gh->GetMarkerSize()*2.0);
           highl->SetX(px[minidx]);
           highl->SetY(py[minidx]);
       }
       c->Modified();
       c->Update();
   }
}


void test(){
        TCanvas* c = new TCanvas();
        g1 = new TPolyMarker();
        g2 = new TPolyMarker();
        for(int i=0; i<50; ++i){
                for(int j = 0; j< 10; ++j){
                        double x1 = i;
                        double x2 = i + 0.5;
                        double y1 = j * 5;
                        double y2 = j * 5+ 3;
                        g1->SetNextPoint(x1, y1);
                        g2->SetNextPoint(x2, y2);
                }
        }
        g1->SetMarkerStyle(20);
        g2->SetMarkerStyle(20);
        g1->SetMarkerSize(0.4);
        g2->SetMarkerSize(0.4);
        g1->SetMarkerColor(kRed);
        g1->SetMarkerColor(kBlue);
        TH1F* frame = gPad->DrawFrame(0., 0., 50., 50.);
        frame->SetTitle("EventDisplay" );
        frame->GetXaxis()->SetTitle("X [mm]");
        frame->GetYaxis()->SetTitle("Y [mm]");
        TLine* l = new TLine(0, 25, 50, 25);
        g1->Draw("P");
        g2->Draw("P");
        //~ g1->SetHighlight();
        //~ g2->SetHighlight();
        c->Connect("ProcessedEvent(Int_t,Int_t,Int_t,TObject*)", nullptr, nullptr,
               "highlight(Int_t,Int_t,Int_t,TObject*)");
}