we’re trying to write a calligraphic R (\cal{R} in LateX) in the title of a histogram. I understand that’s currently not possible, but would be happy to be proven wrong.
I’ve seen old messages requesting this, but haven’t seen the solution. I did find a promise that it might be possible to do this in ROOT 6.0, but we need a solution on the time scale of days, rather than weeks.
If there is no solution to this problem in ROOT, we may simply post-process the PS file. The calligraphic R is actualy not part of the /symbol set either, so if anyone knows how to introduce the symbol in the PS file by hand, that’s very welcome…
As mentioned by Olivier, this should be possible in TMathText, and using “\mathscr{R}” (just like TeX).
Note that in TeX nomenclature, there is a distinction between calligraphic/\mathcal (brushstroke) and script/\mathscr (metallic quill/English script). Because Unicode has script but no brushstroke code points, only \mathscr is implemented.
import ROOT
x = [0,1,2,3,4,5,6,7,8,9]
y = [1,2,3,4,5,5,4,3,2,1]
N = 3
g = {}
mg = ROOT.TMultiGraph()
for i in range(N):
g[i] = ROOT.TGraph()
for j in range(len(x)):
g[i].AddPoint(x[i], y[i])
g[i].SetMarkerStyle(20)
g[i].SetMarkerColor(i+2)
for j in range(len(x)):
y[j] = y[j] -1
mg.Add(g[i])
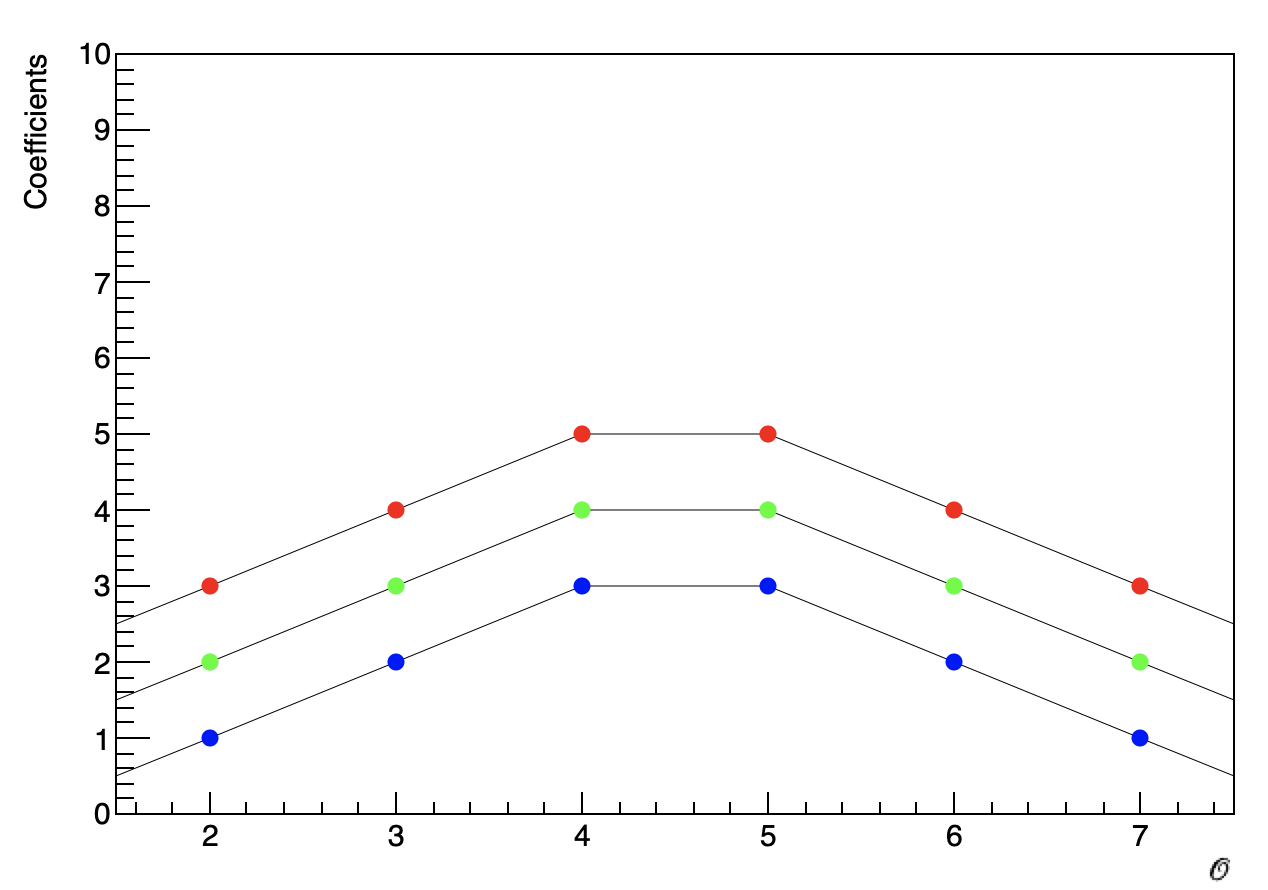
mg.Draw("APL")
mg.GetXaxis().SetTitle("E_{#gamma} (GeV)")
mg.GetYaxis().SetTitle("Coefficients")
ROOT.gPad.Modified()
mg.GetXaxis().SetLimits(1.5,7.5)
mg.SetMinimum(0.)
mg.SetMaximum(10.)
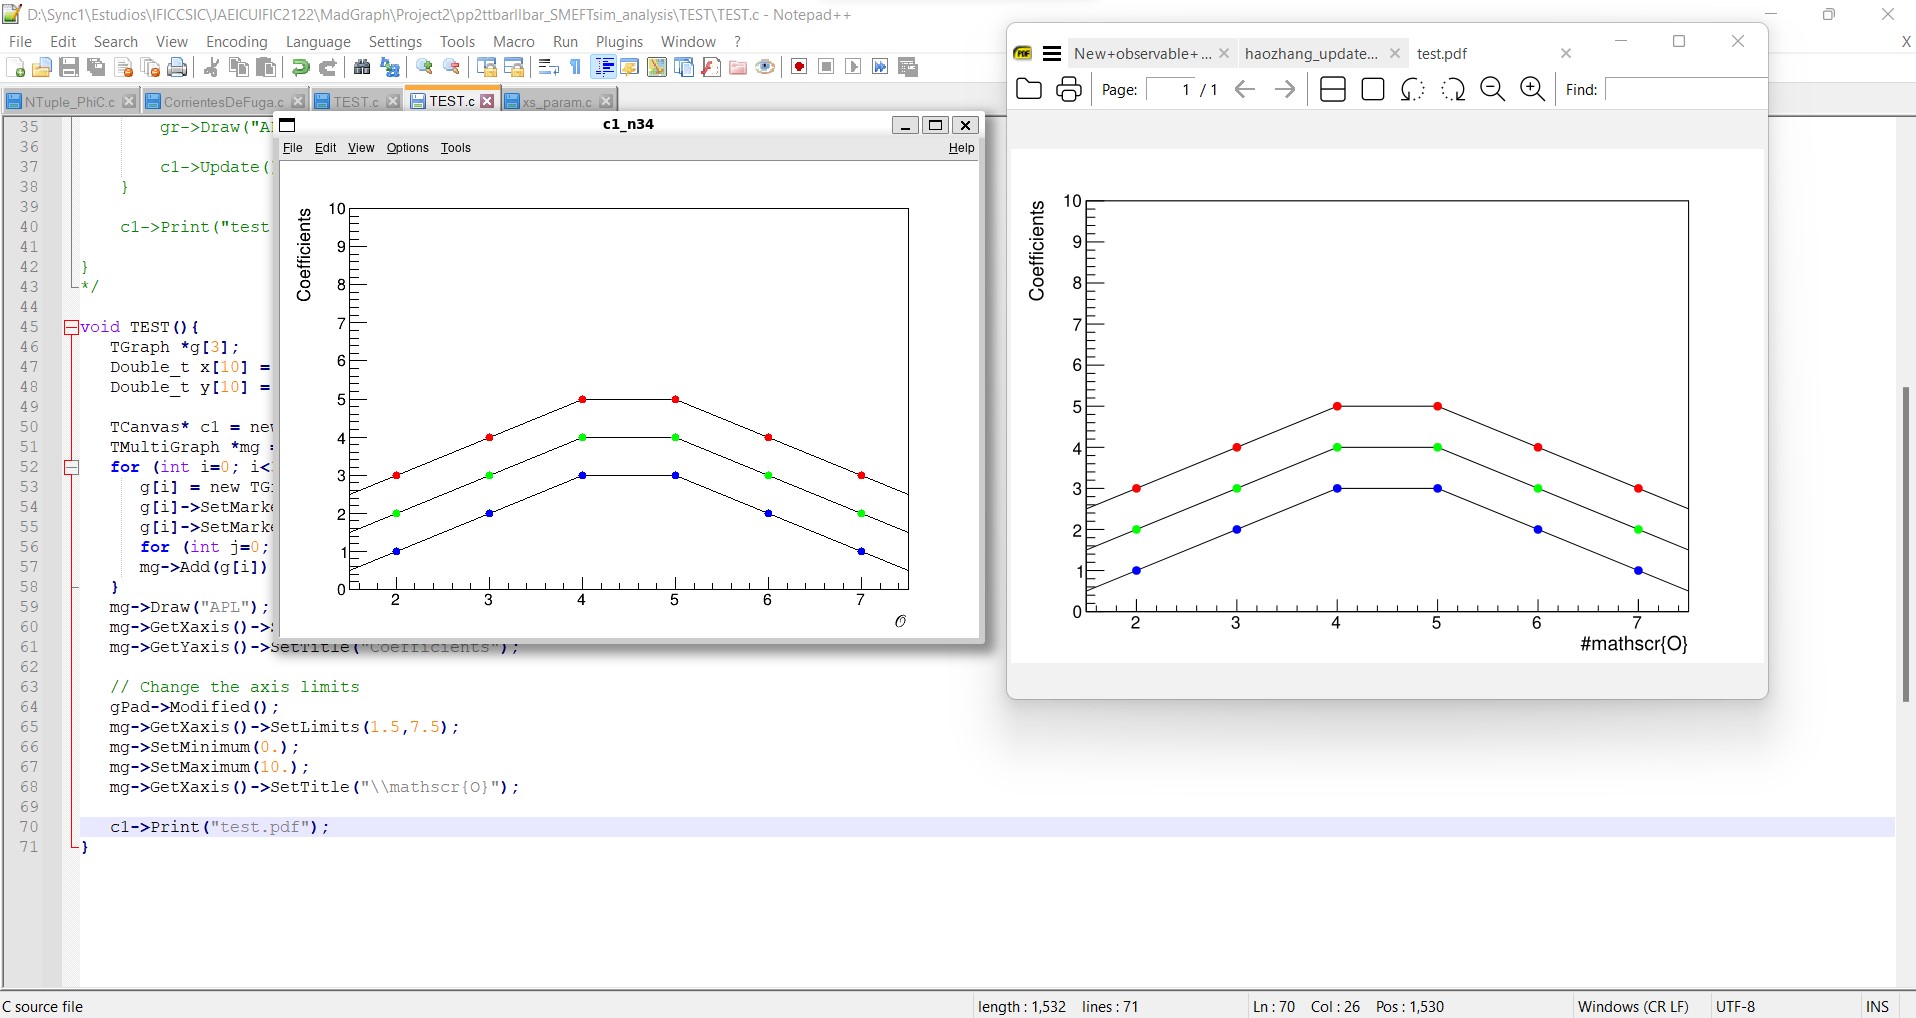
mg.GetXaxis().SetTitle("\\mathscr{O}")
So the problem is not in the code, it seems that the problem comes when the canvas is printed as a pdf. Because if I save it as png, calligraphic symbol is ok.