Good day Root experts,
The CLs can be calculated using the distribution of test statistic for background data and signal plus background data. CLs = CLsb/CLb, but to calculate CLb and CLsb, one need to get the value q_obs(the value of test statistic observed from a dataset ), i am wondering how you the value of q_obs is determine in RooStats. Does it choose a value of test statistic of background-only hypothesis?
That depends what kind of tool you are using. In general, if you provide data, it just fits the model to the data, and the result of that is q_obs.
In toy experiments, there can be a q_obs from toy data, but here it depends how the toy data were constructed.
Actually, my problem goes when i try to run the StandardHypoTestInvDemo.C . This is the resulting distribution of test statistics.
, so this is my model
CountingModel2.C (1.4 KB) (the name is countingmodel but this is not really counting model but a model of full shape). My number of signal is my POI, with range s=[0,30] but i am quite confuse with the value of my q_obs at low value of s,maybe i consider negative values?
I think, its just okay and i just overthink it. Because at low value of s, the value of test statistic will approach to zero (since likelihod ratio will approach to 1). By the way sir, I am quite interested with the median expected of my signal strength with the plus minus(1,2) sigma. Can you gimme insights on how to execute it in RooStats? In the end of run of StandardHypoTestInvDemo.C, some words are printed ,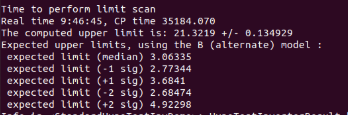 .Correct me if i am wrong please, the value upper limit of 21.3219 is the value of s when it intersect at the confidence level right? So, what is the value expected limit (median) = 3.06335 mean?
Yes.
The expected limit shows how sensitive your analysis is. It “simulates” (=toy or asymptotic formulae) an experiment where you have background as expected, and but zero signal events in data. It then sets a limit for how much signal there can be, which comes out at 3 in your case. That means that without any signal in the data, you would exclude S = 3 at xx% confidence level. The more sensitivity your fit model has (e.g. more statistics), the lower this expected limit can be.
Given that your observed limit is much more than that, there seem to be a few signal events in the data.
Hello. Stephan,
Let me clarify it. So, Expected limit is the number of signal that i can exclude at xx% confidence level in an experiment where i expect that i can see only a background events. And the Observe limit, is the minimum number of signal event that i can exclude at xx % confidence level when in an experiment where i expect to see both signal and background.
The difference between expected and observed is this:
- Expected: It simulates an analysis based on the fit model. It takes the background-only hypothesis, and measures what values of the signal parameter can be excluded. It actually doesn’t use the data for that.
- Observed: It uses the data, and measures q_obs. From this, the limit is calculated. So this is the result of the “real” measurement.
Okay sir. Thank you for your explanation.
