I am trying to calculate the p-value of a Null hypothesis using FrequentistCalculator and HypoTestResult::NullPValue(). My expectation is that the p-value for the Null hypothesis should not depend on the signal model. However I find there is some dependence. For example:
It is normal to have some signal dependency, because the signal model is used to define the test statistics. Using for example the profile likelihood ratio, the denominator of the test statistics is the best fit model likelihood value, where the model is the Signal plus background model.
In your case, you are getting very large p-value, which means that the fit with S=0 or S different than zero gives compatible values. Probably the best S value is very close to zero, which makes the fit not working very well and then depending slightly on the input signal range.Also in that case, small changes in the delta-log-likelihood value will result in large p-value changes, because you are in the closer to the zero peak of the test statistics distribution ( half-chi2 with ndf=1).
I would check your fits and use as correct result the one that gives you the minimum of the negative-log likelihood.
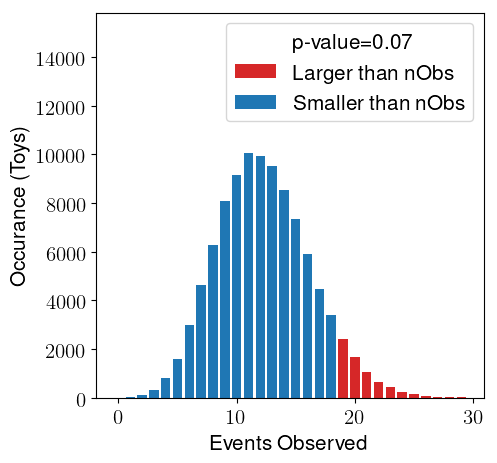
Thank you so much for explaining this. If I can ask a followup question, is there a way in RooStats to calculate the p-value without using the likelihood? For example, using “number of observed events” as the test statistic as shown here?
If you could point us to this, that would be very helpful. Thank you very much for your help with this.
You can use the RooStats::NumEventsTestStat class and pass as test statistics to the RooStats::ToyMCSampler` and then the p value will be computed from the distribution of observed events as in figure above