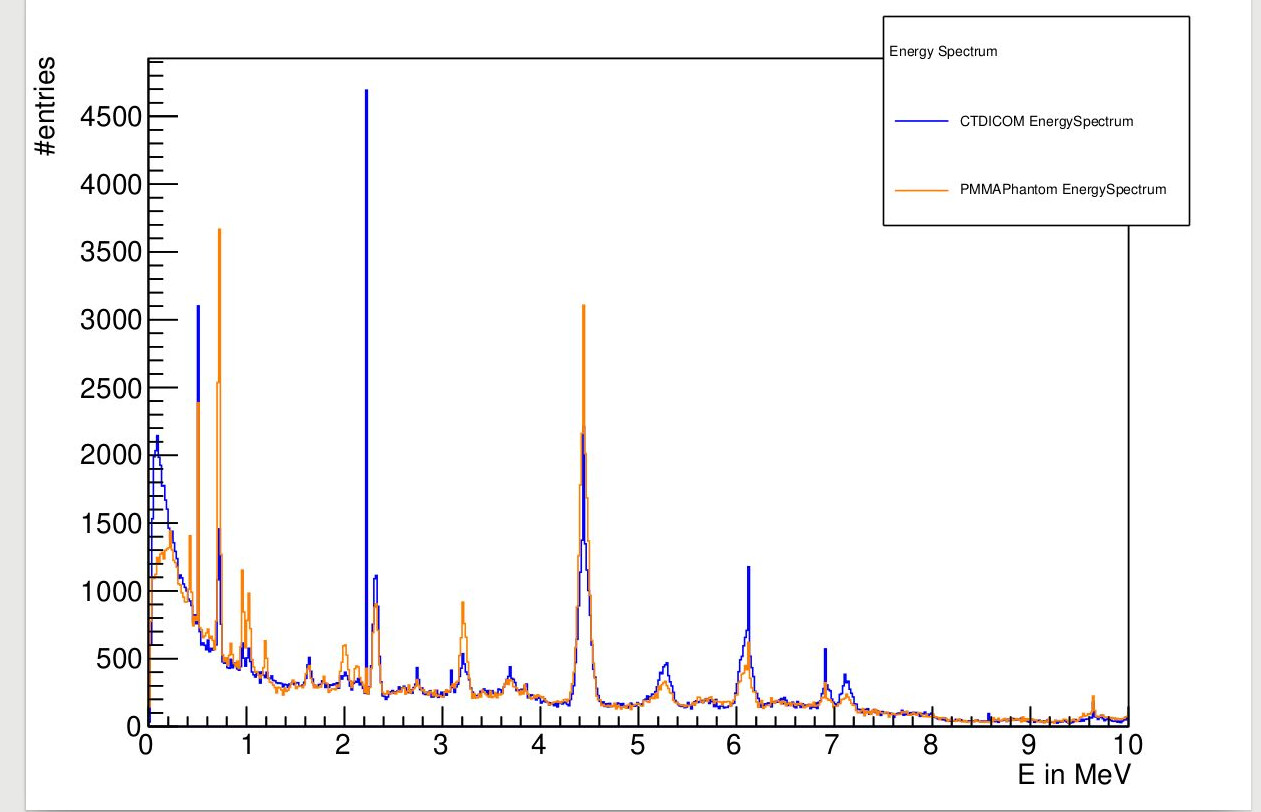
I have 2 Root files from two different Simulation and as seen in the image is a comparison between energy spectrum of prompt gamma radiation produced from proton interactions. Since this is the last part of my thesis I want a help in this part please.
I want to Calculate the number of entries in some peaks in the histograms and since those entries are absolute number I want also to normalize the Histogram, moreover drawing error bar graph of uncertainties of both histograms and compare between them.
-peaks of interest are (0.71, 2.3, 4.43, 6.128) MeV.
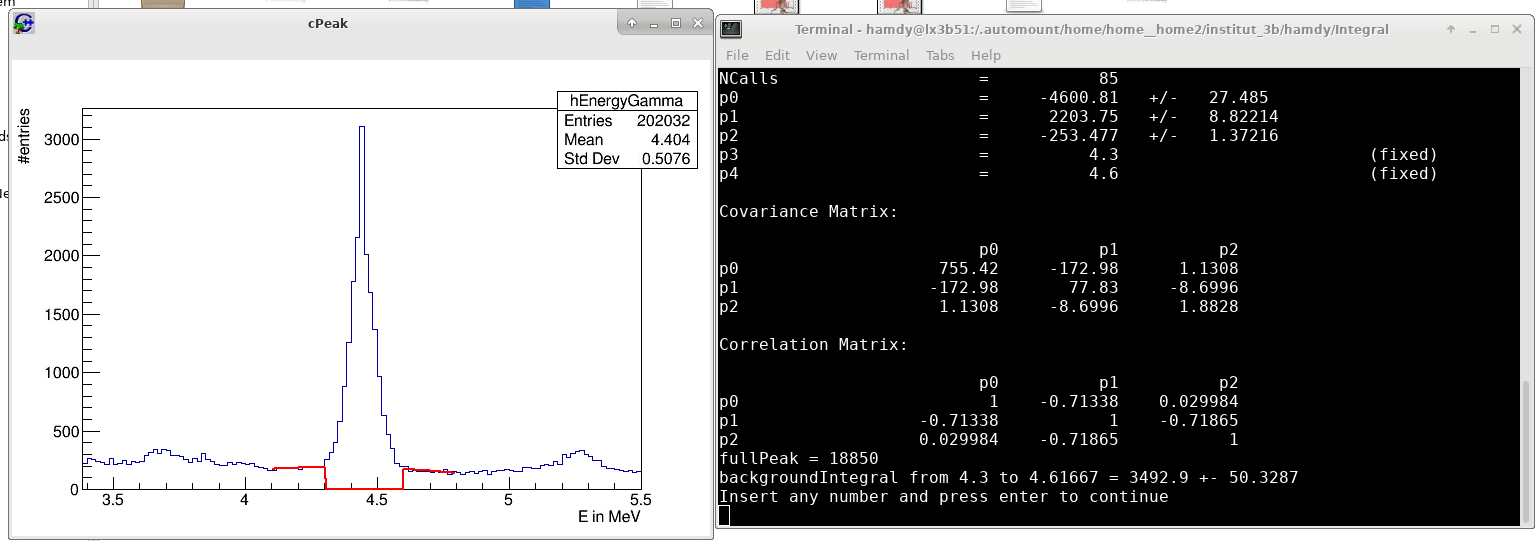
I did a simple code to calculate number of entries in a specific peak but since each peak has an energy range I estimated binX1 and binX2 on X-axis by eye. but I want to do it by a scientific way to be accurate as possible.
You can use peak-finding algorithms that make this a bit more scientific. Or maybe better, fit the background, apply some cut on the signal height, and look for bins that have entries > background + minimal_signal_height. Then fit these ranges (Gaussians?); take the fit integral and that’s the number of entries in the peaks.
You can normalize a histogram by calling hist->Scale(1./hist->GetSumOfWeights()) (which excludes entries in under- and overflow bins).
I tried the peak Finding algorithms with TSpectrum class if u mean this method and this does not help too much or I could say , it is only finding the peak and I already know the peaks I want. I tried also fitting by TF1 and it somehow works but still I have to estimate range of Xmin and Xmax by eye here is the point to be more scientific is there is a possibility to calculate peak integral by calculating FWTM or some thing like this and this could be helpful.
In the following code u will find the code I have done to generate the following Canvas.
Once you fit you can use the fit’s TF1::Integral(). For fitting you indeed need to give starting values for the parameters; for any “reasonable” value you should arrive at more or less the same fit result. Both elements are bringing the “scientific stability” you’re after