Dear ROOTers,
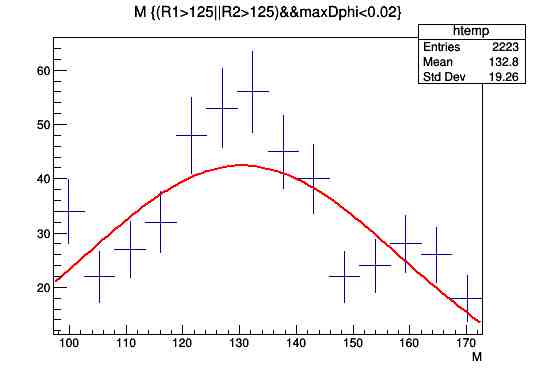
I am a total newbie and I would like your help please. I have a dataset which I successfully create a histogram for, cutting to the parameters I need and adding a Gaussian, however I do all these actions using the graphical interface. As a result, when I create a .c file I only find a graph and no code. How can I record everything that I am doing as code that can be run on a different computer? Never used C and I am not savvy with bins etc. I read the beginner’s guide but I still have trouble in translating my actions into code! I uploaded an example of one of the graphs I created. The code bit is empty so not sure how to save it as a macro.
Thanks!
Please read tips for efficient and successful posting and posting code
ROOT Version: 6.22.06
Platform: Windows 10 Enterprise
Compiler: Not sure, I think I run it from source, as I only run root and it opens a ROOT session