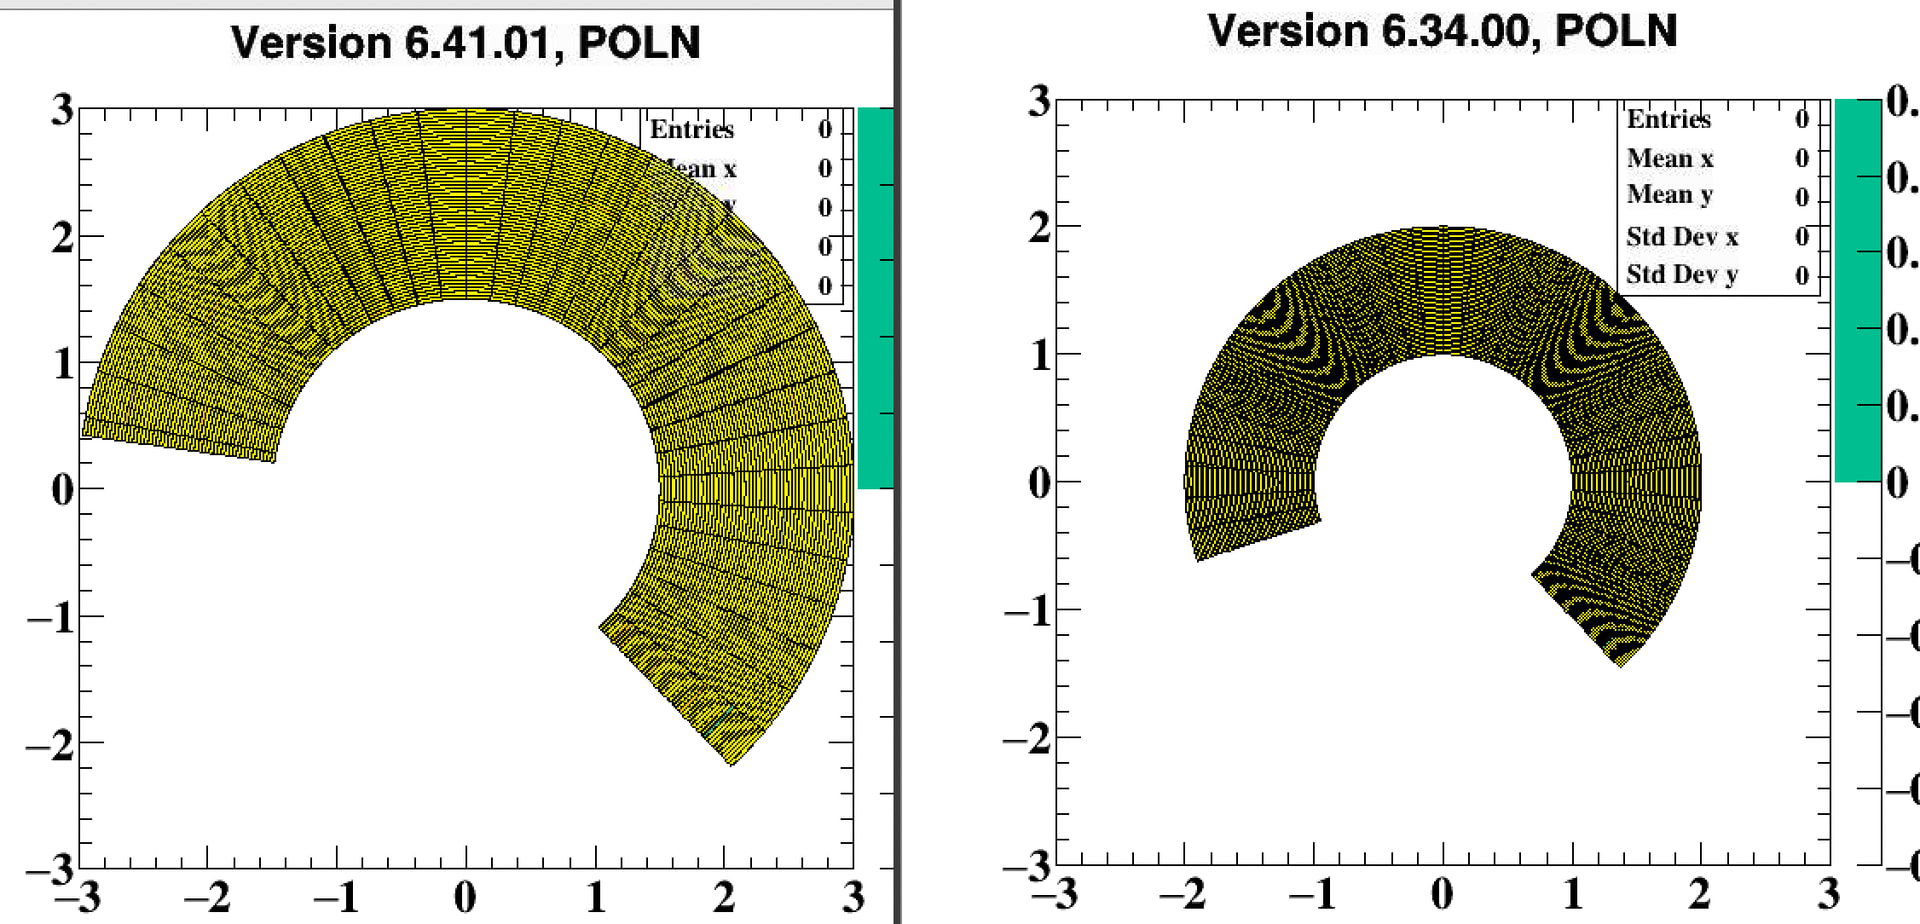
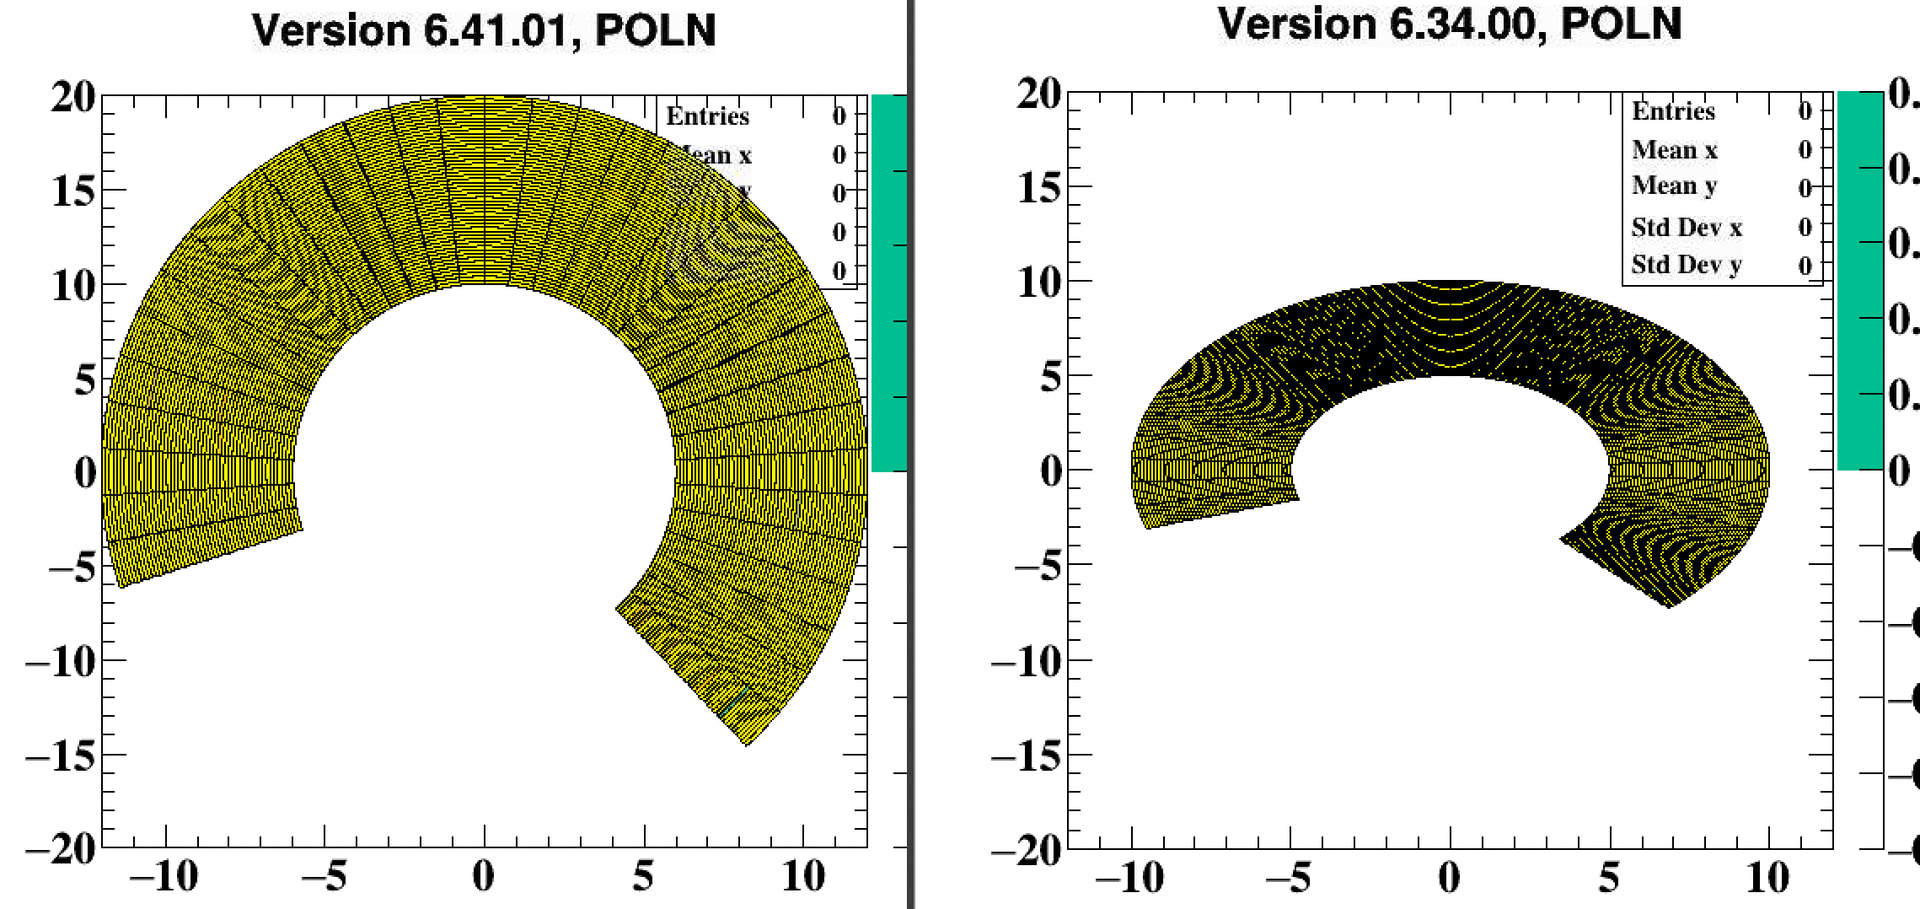
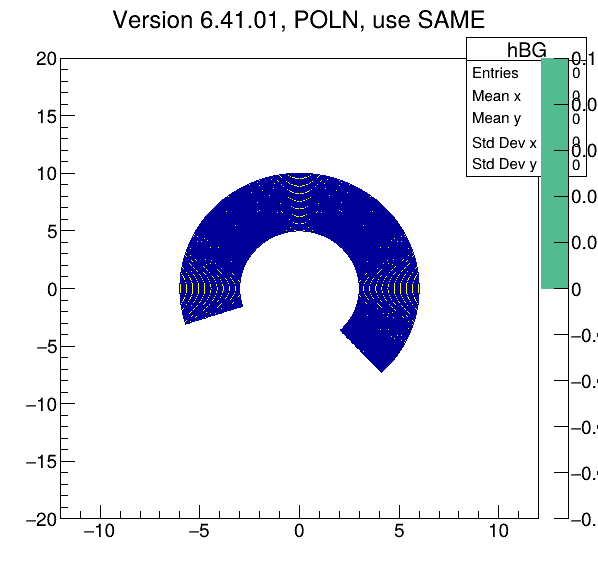
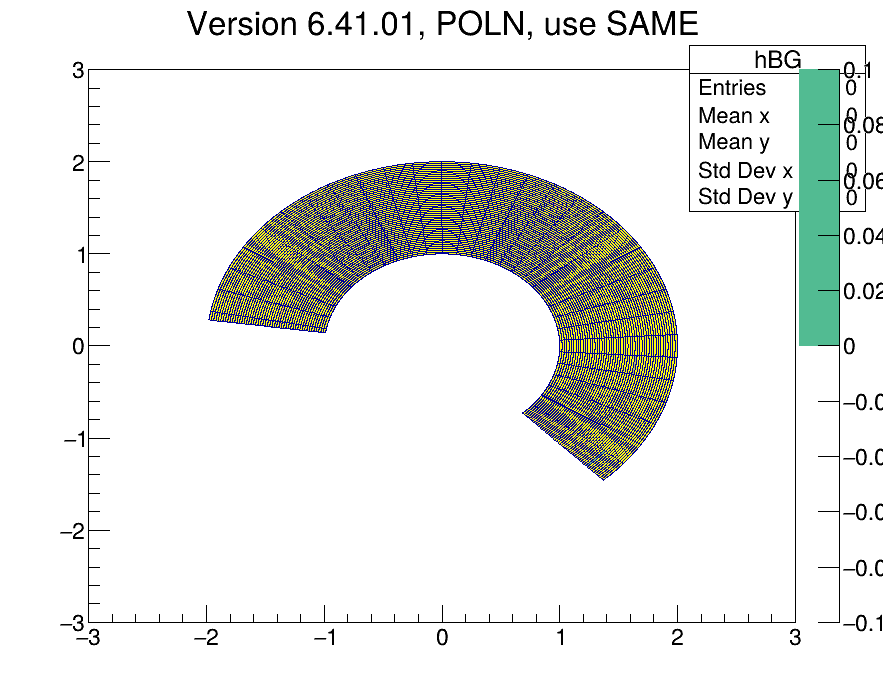
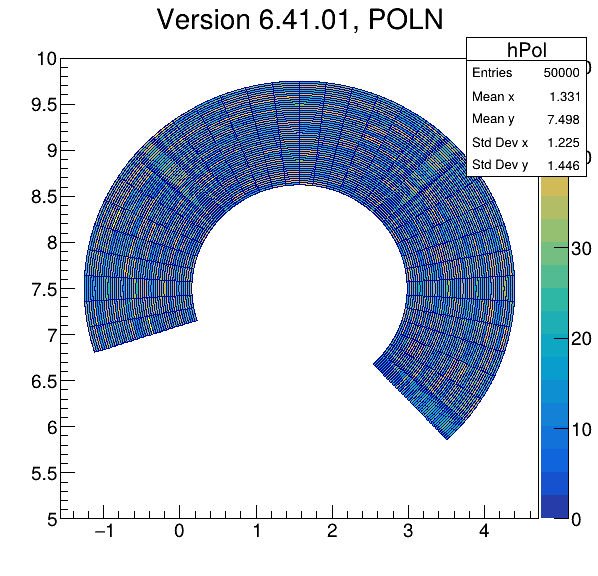
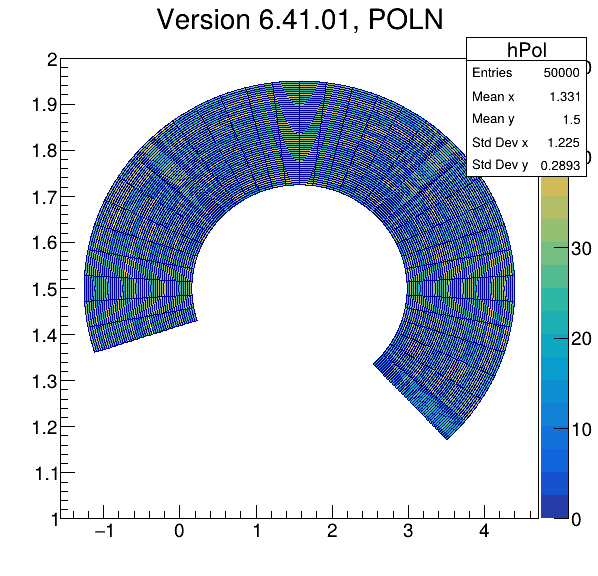
Bug report: TH2::Draw with option "POL" wrongly transforms the coordinate for v6.36 and later

Dear experts,

I found a bug with the “pol” option of the TH2::Draw method for recent ROOT versions (6.36 and later). My guess is that something goes wrong with the mapping from the polar coordinate to the Cartesian coordinate.

The attached plots are produced by running a macro coded below in different ROOT versions:

{
   auto c1 = new TCanvas("c1", "Polar Histogram", 600, 600);
   auto h = new TH2D("h", Form("Version %s", gROOT->GetVersion()), 100, -12, 12, 100, -12, 12);
   auto h2 = new TH2D("h2", "Polar Plot", 50, -1*TMath::Pi(), TMath::Pi(), 50, 5, 10);
   gRandom->SetSeed(10);
   for (int i = 0; i < 50000; i++) {
      double angle = gRandom->Uniform(-TMath::Pi(), TMath::Pi());
      double radius = gRandom->Uniform(5, 10);
      h2->Fill(angle, radius);
   }

   h->Draw("");
   h2->Draw("SAME COLZ POL");
}

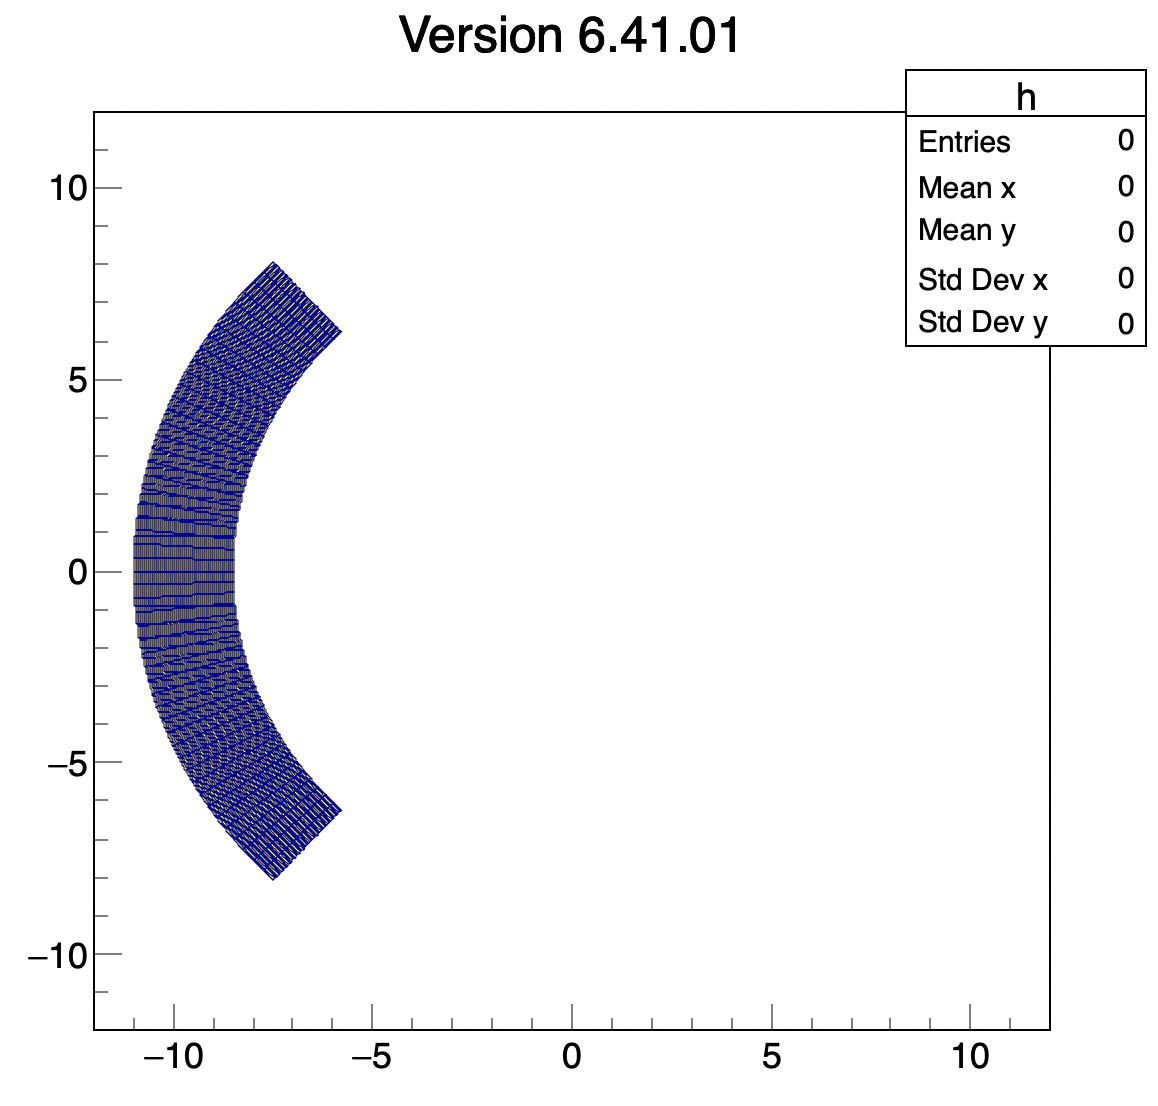
Here, the region with 5 < \sqrt{x^2+y^2} < 10 in the histogram must be filled in the full -\pi<\theta<\pi range, as is the case for version 6.34. However, the attached plots produced by 6.36 and 6.38 are filled with the wrong radius only in the limited angle range.

All these plots were produced inside a container environment distributed on DockerHub, rootproject/root.
Tested versions used to produce the plots are

  • docker://rootproject/root:6.38.00-ubuntu25.10

  • docker://rootproject/root:6.36.00-ubuntu25.04

  • docker://rootproject/root:6.34.00-ubuntu24.10

Best regards,
Atsushi
Welcome to the ROOT forum.
I’ll check

I see the same with ROOT master on Mac:

The change of behavior has been introduced by this PR from @linev. You can see the explanations in the PR commit’s comments. @linev is on holidays right now. He can comment when he will be back.

Thank you very much for the support.

I went through the source code committed there, trying to understand how it behaves.

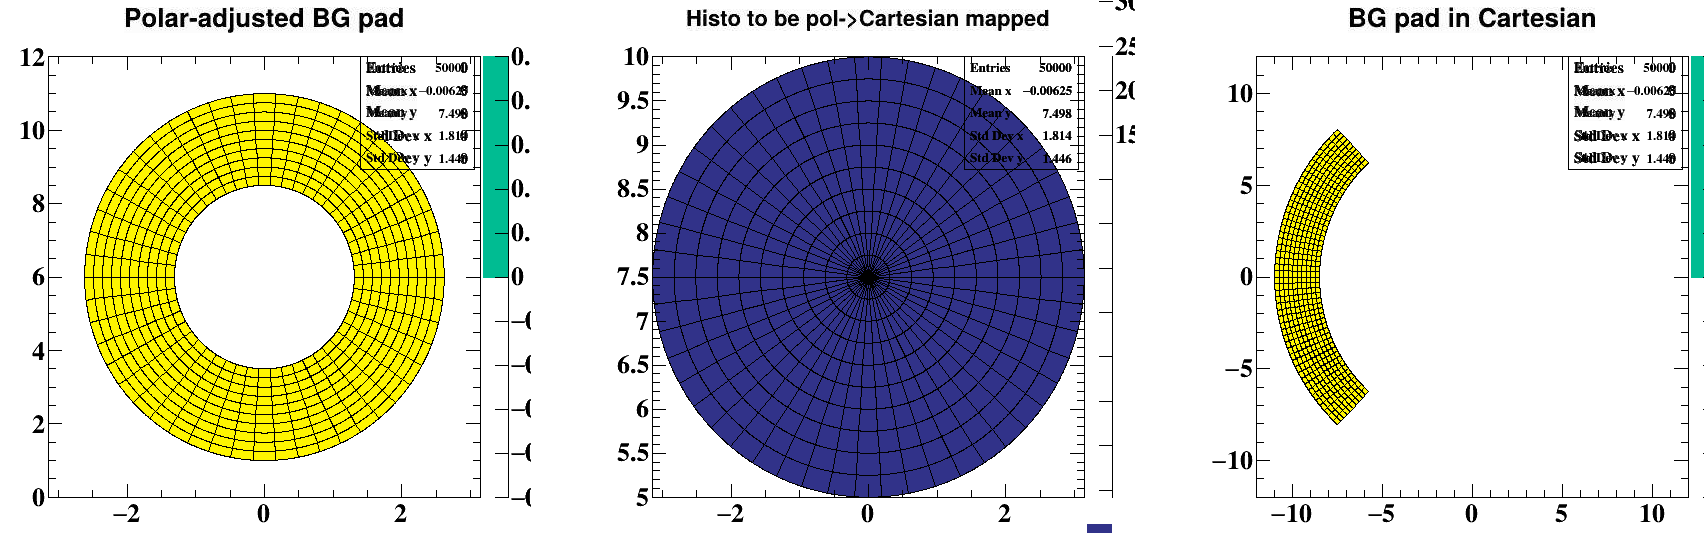
I ran the following test macro (v6.36) and got the attached plot:

{
   auto c1 = new TCanvas("c1", "Polar Histogram", 1200, 400);
   auto hBG = new TH2D("hBG", Form("Polar-adjusted BG pad"), 100,  -TMath::Pi(), TMath::Pi(), 100, 0, 12);
   auto h = new TH2D("h", Form("BG pad in Cartesian"), 100, -12, 12, 100, -12, 12);
   auto h2 = new TH2D("h2", "Histo to be pol->Cartesian mapped", 50, -1*TMath::Pi(), TMath::Pi(), 10, 5, 10);
   gRandom->SetSeed(10);
   for (int i = 0; i < 50000; i++) {
      double angle = gRandom->Uniform(-TMath::Pi(), TMath::Pi());
      double radius = gRandom->Uniform(5, 10);
      h2->Fill(angle, radius);
   }

   c1->Divide(3,1);
   c1->cd(1);
   hBG->Draw("");
   h2->Draw("SAME COLZ POL");
   cout << Form("Uxmin: %.2f, Uxmax: %.2f, Uymin: %.2f, Uymax: %.2f", gPad->GetUxmin(), gPad->GetUxmax(), gPad->GetUymin(), gPad->GetUymax()) << endl;
   c1->cd(2);
   h2->Draw("COLZ POL");
   c1->cd(3);
   h->Draw();
   h2->Draw("SAME COLZ POL");
}

My findings here are that the current “pol” option gives the actual polar coordinate of \theta = 2\pi \frac{x_{pol} - x_{BG}^{min}}{x_{BG}^{max} - x_{BG}^{min}} and r \propto y_{pol} - y_{BG}^{min} , where x,y_{BG}^{min,max} are the xy-range of the background histogram objects (hBG for 1st pad, h2 for 2nd pad, h for 3rd pad) and x,y_{pol} are the xy-value at each bin of the histogram objects drawn with “pol” option. For example, in the 3rd plot, the angle range is limited because calculating something like \theta = \frac{3.14 + 12}{24} for x=3.14 bin of h2 object.

Though the histogram itself in the first drawing is geometrically correct, the axis is taken from the background histogram object. Anyway, let’s wait for comments from the committer.

Atsushi

Yes it is better @linev does the follow up.