Bug or feature in TTree::Draw()?

ROOT Version: tested on 6.32.08 and 6.32.10
Platform: tested on Linux Mint 22.1

ROOT developers,

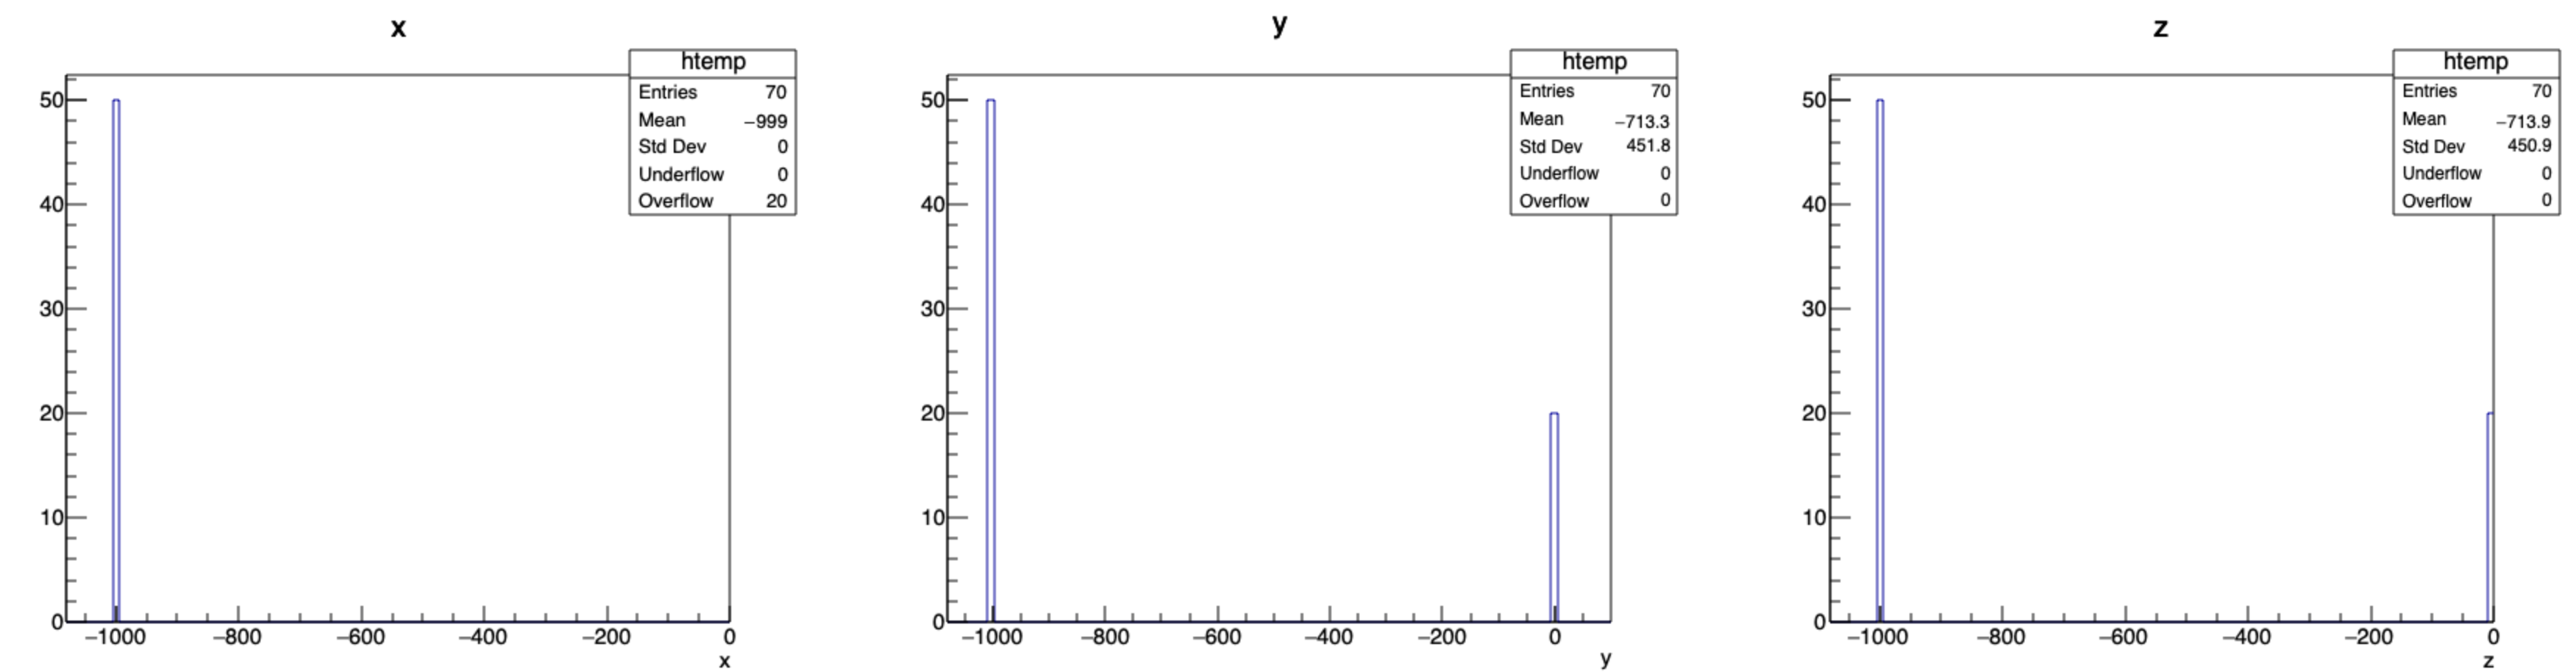
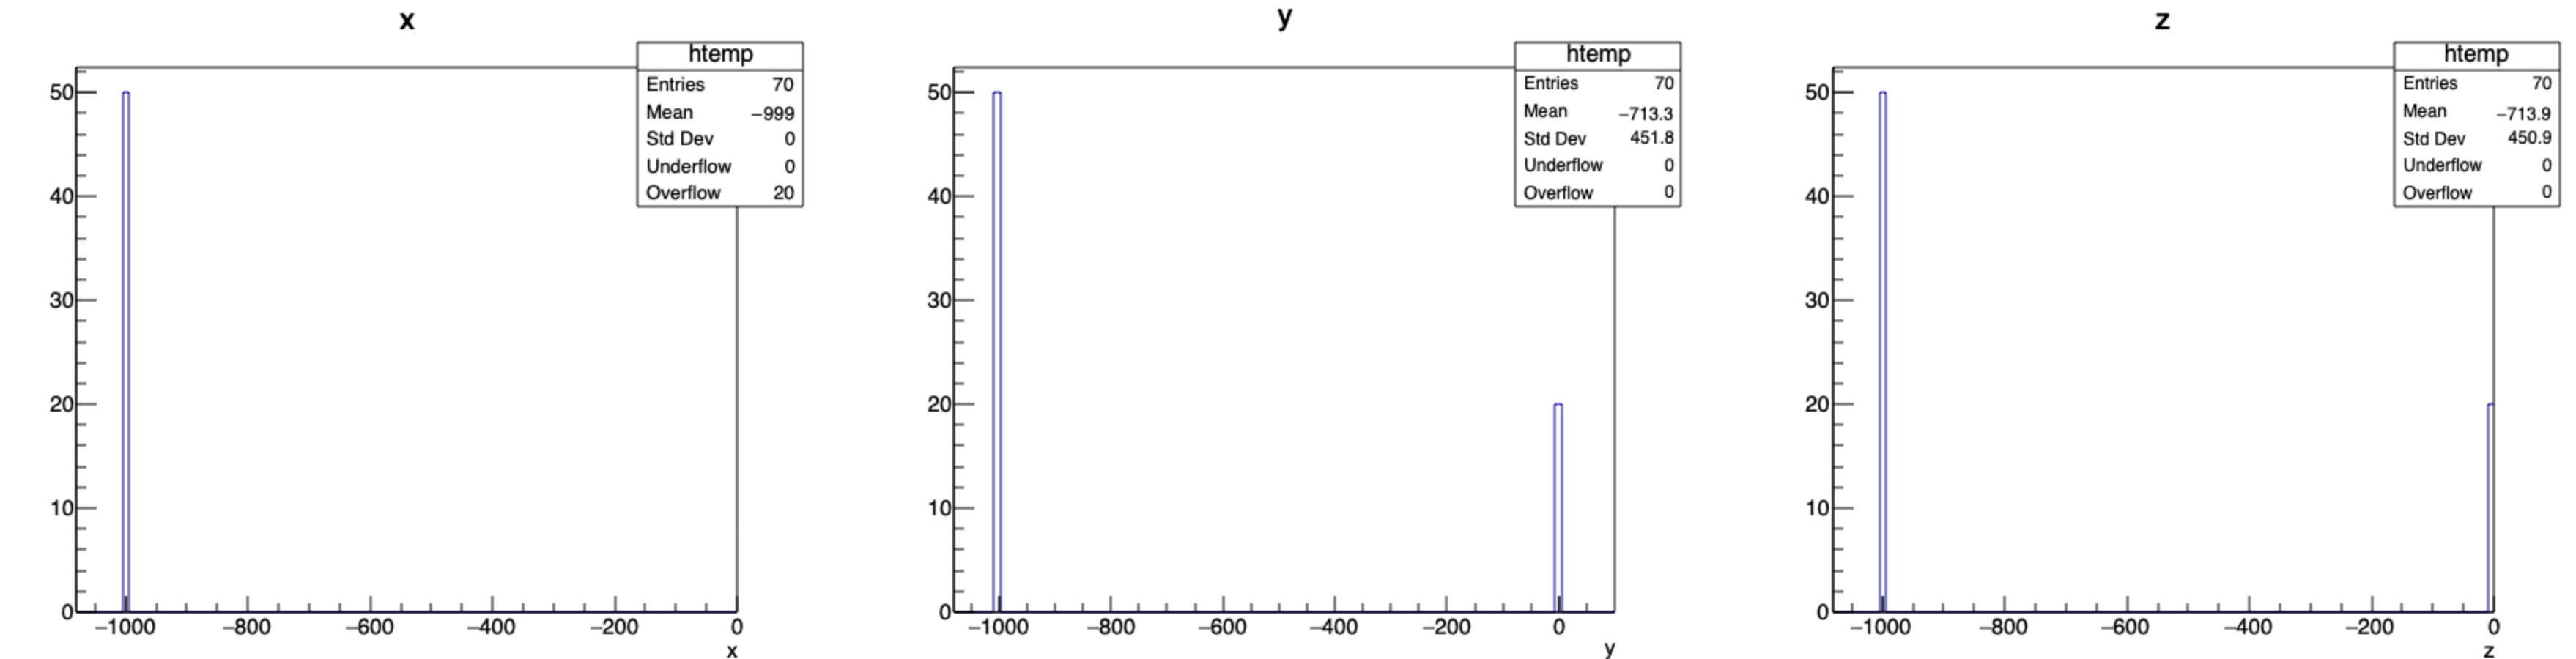
Not sure, but this might be a bug (or unexpected feature for me) in TTree::Draw. When the tree branch/leaf only contains entries with negative and zero values (exactly equal to zero), and no positives, doing Draw does not show the entries at zero; this seems to happen for float and double, but not for int (see below).
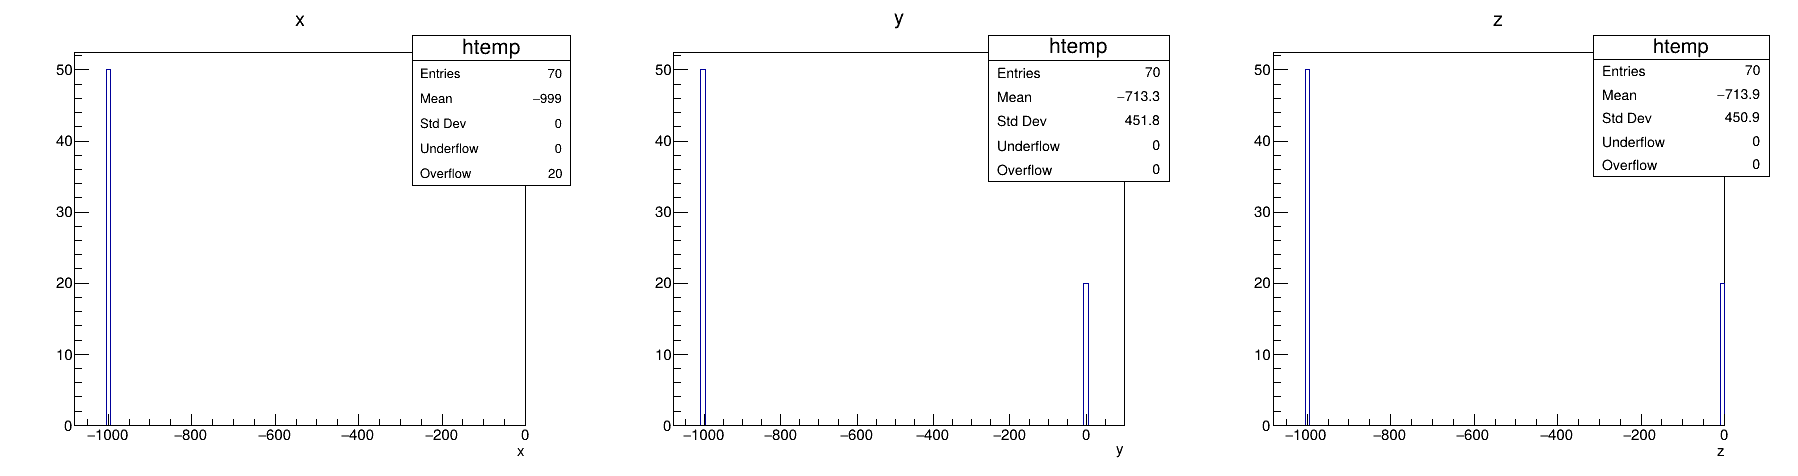
I noticed this with v6.32.08, and the one just released (6.32.10) shows the same. Here is an example (note that x is filled with -999 and zero, y with -999 and 1, z with -999 and -1):

{
  gStyle->SetOptStat(111111);

  auto c = new TCanvas("c", "c", 1800, 500);
  c->Divide(3,1);
  //int x, y, z;
  //float x, y, z;
  double x, y, z;

  auto T = new TTree("T","Tree");
/*
  T->Branch("x",&x,"x/I");
  T->Branch("y",&y,"y/I");
  T->Branch("z",&z,"z/I");

  T->Branch("x",&x,"x/F");
  T->Branch("y",&y,"y/F");
  T->Branch("z",&z,"z/F");
*/
  T->Branch("x",&x,"x/D");
  T->Branch("y",&y,"y/D");
  T->Branch("z",&z,"z/D");

  for (int i=0; i<50; ++i) {
    x = -999;
    y = -999;
    z = -999;
    T->Fill();
  }
  for (int i=0; i<20; ++i) {
    x = 0;
    y = 1;
    z = -1;
    T->Fill();
  }

  c->cd(1);
  T->Draw("x");
  c->cd(2);
  T->Draw("y");
  c->cd(3);
  T->Draw("z");
}

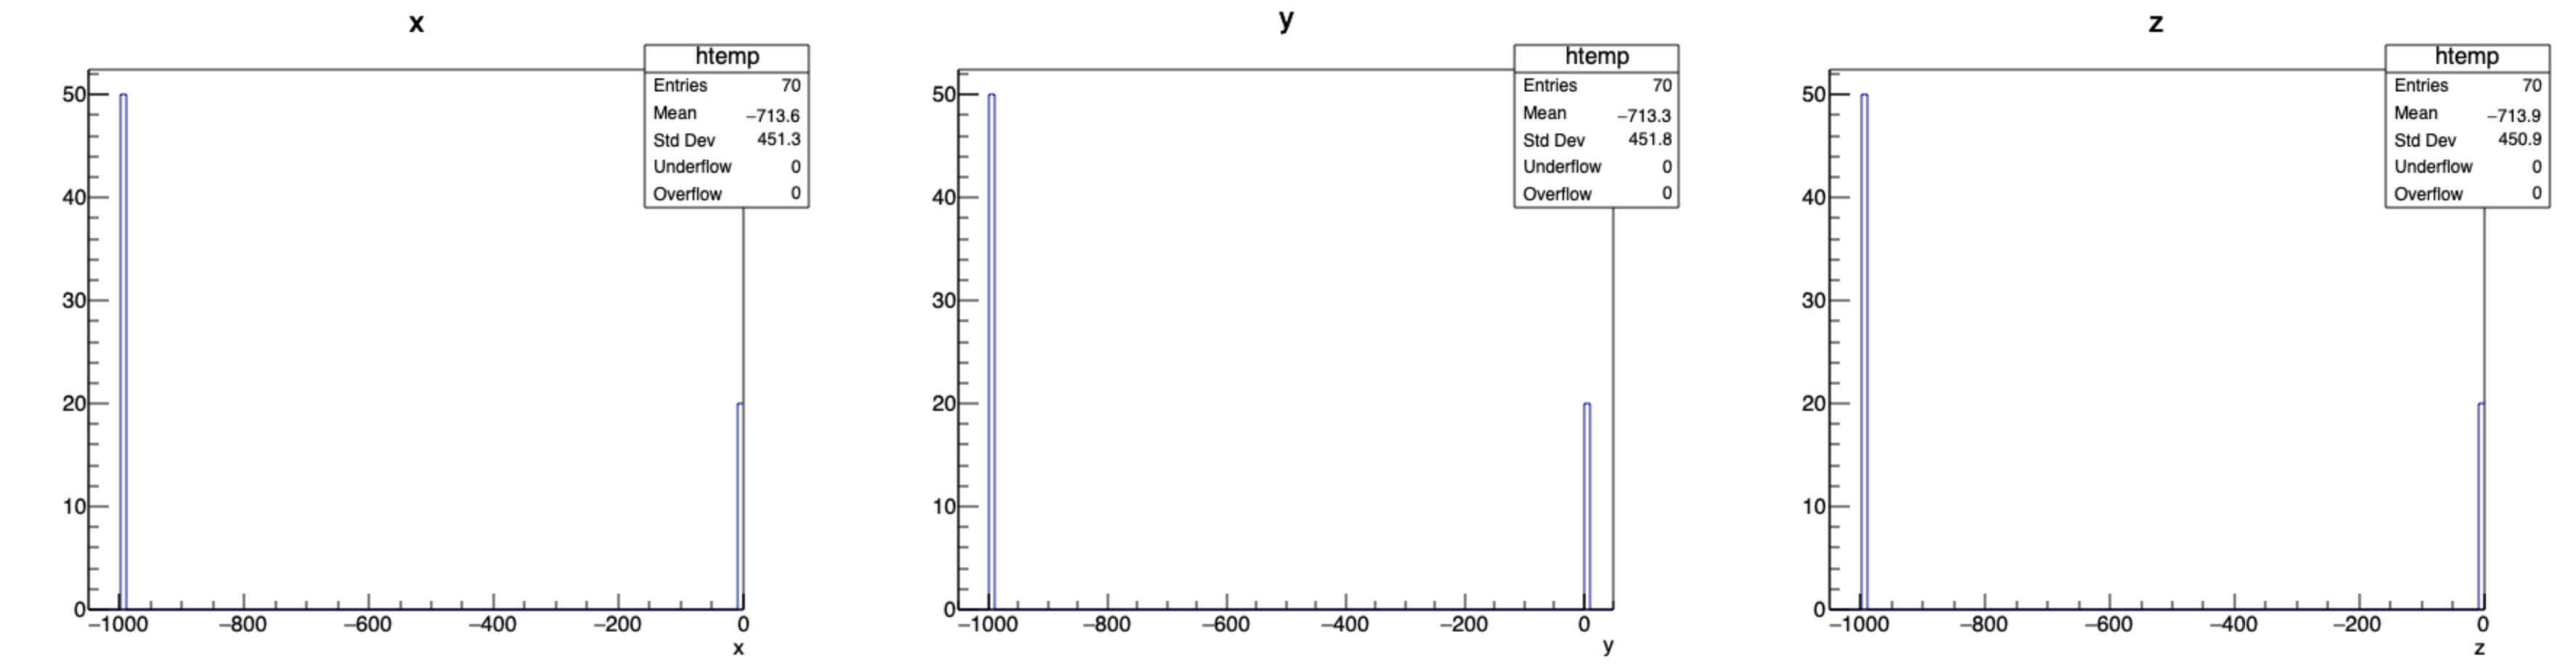
Float and double produce the same results:


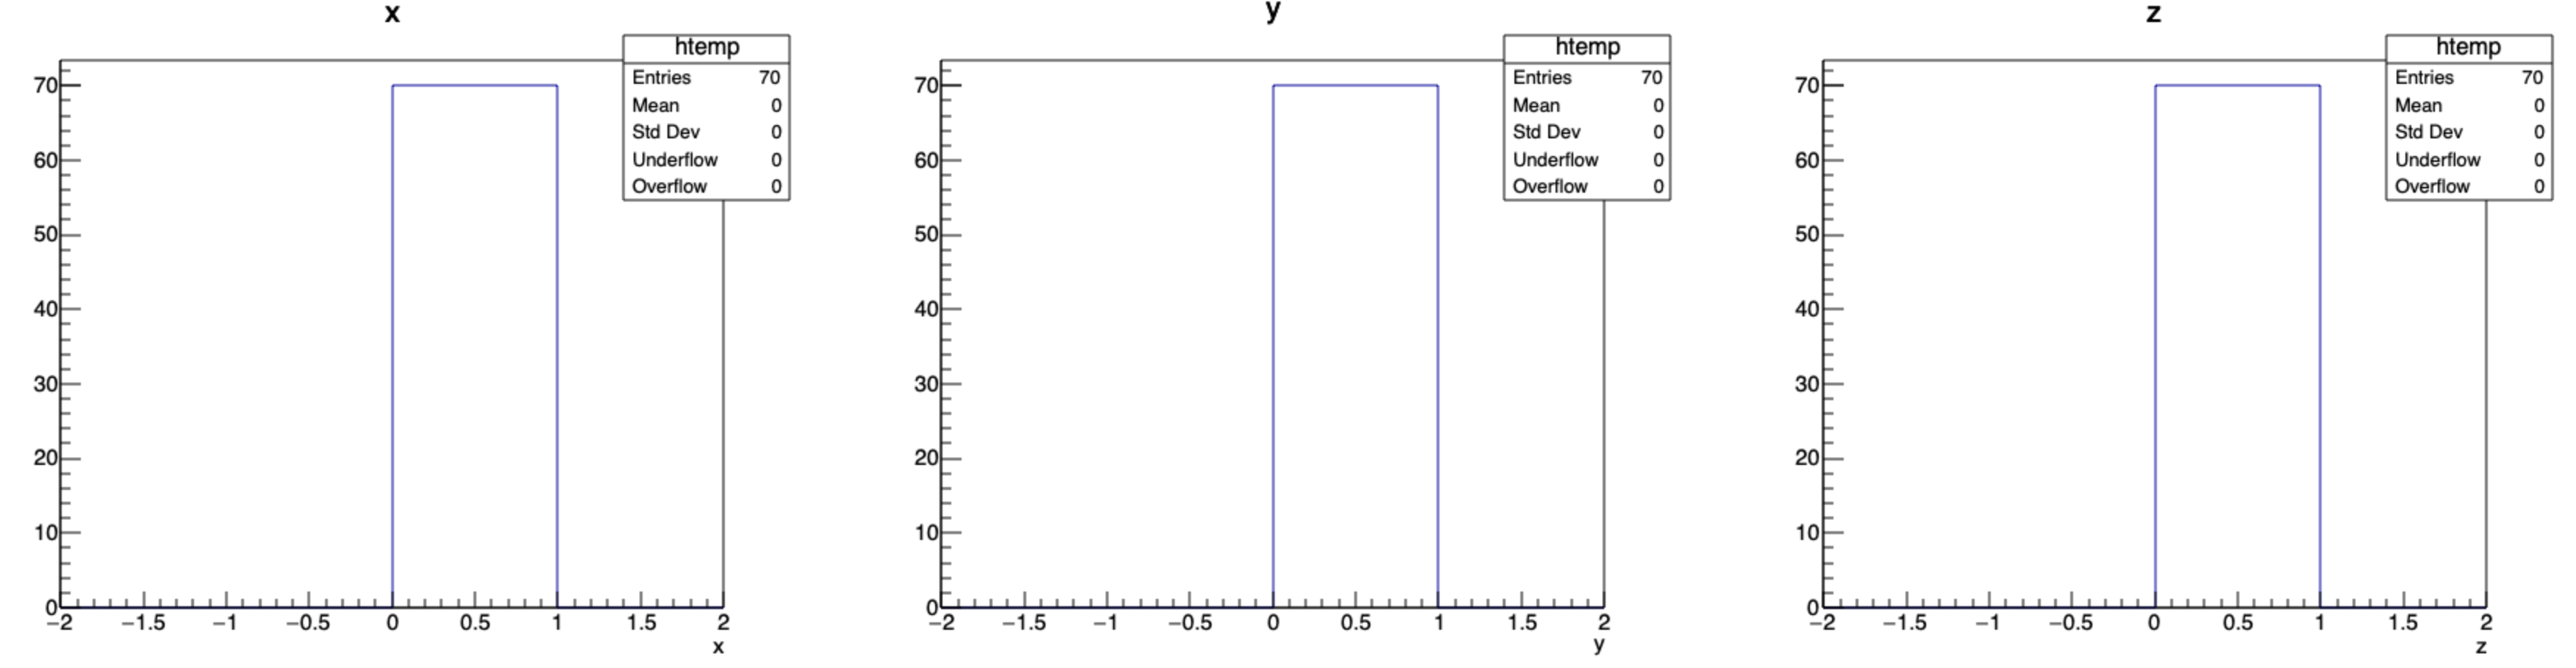
While int results in:

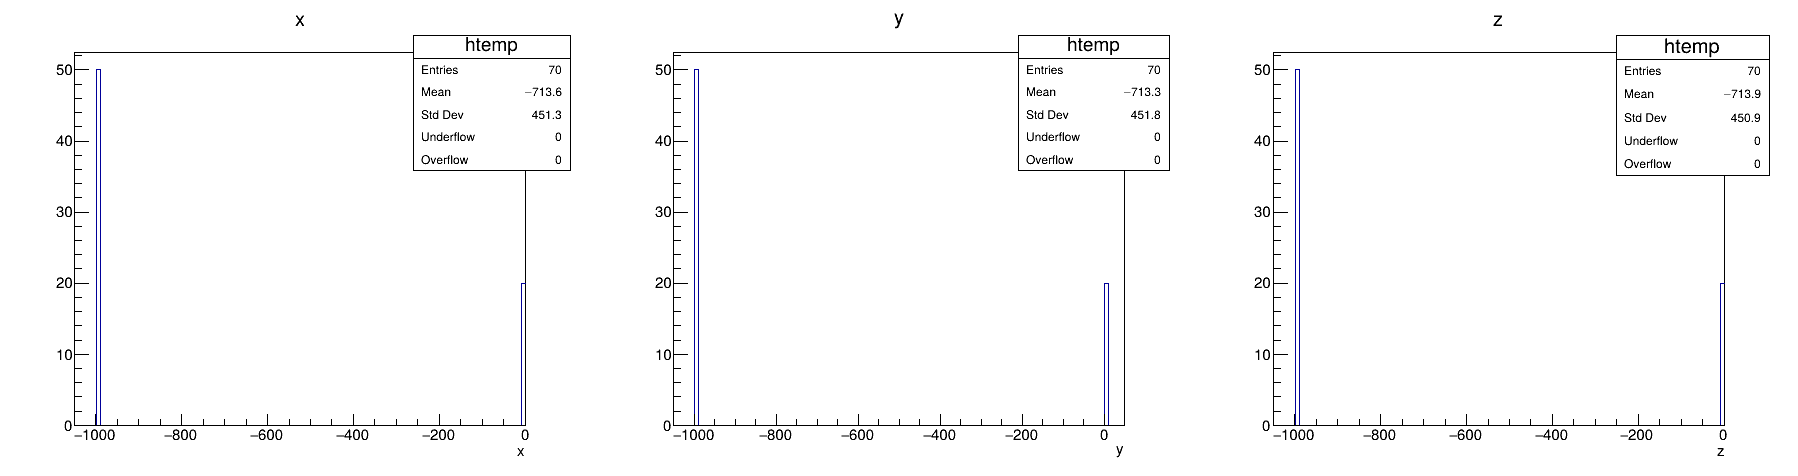
In this example the negatives (-999) are relatively far from 0, but I also tested down to -1 and the same still happens.
Note also that although the reported number of entries is always correct, the mean value (of x) is affected in the case of double and float, as the entries are sent to the overflow.

Edit:
I should also mention that the same thing happens with 2D plots (e.g. change the last line above to T->Draw("x:z","","colz"); to see it)

Not sure if it is a bug or not. I tried with master on Mac. and “int” gives me:

Did you also fill with negatives? It looks like there are only the zeros here.

I ran this:

{
  gStyle->SetOptStat(111111);

  auto c = new TCanvas("c", "c", 1800, 500);
  c->Divide(3,1);
  //int x, y, z;
  //float x, y, z
  double x, y, z;

  auto T = new TTree("T","Tree");
  
  T->Branch("x",&x,"x/I");
  T->Branch("y",&y,"y/I");
  T->Branch("z",&z,"z/I");

//   T->Branch("x",&x,"x/F");
//   T->Branch("y",&y,"y/F");
//   T->Branch("z",&z,"z/F");

//   T->Branch("x",&x,"x/D");
//   T->Branch("y",&y,"y/D");
//   T->Branch("z",&z,"z/D");

  for (int i=0; i<50; ++i) {
    x = -999;
    y = -999;
    z = -999;
    T->Fill();
  }
  for (int i=0; i<20; ++i) {
    x = 0;
    y = 1;
    z = -1;
    T->Fill();
  }

  c->cd(1);
  T->Draw("x");
  c->cd(2);
  T->Draw("y");
  c->cd(3);
  T->Draw("z");
}

Ah, you need to uncomment these lines

//   T->Branch("x",&x,"x/D");
//   T->Branch("y",&y,"y/D");
//   T->Branch("z",&z,"z/D");

and comment out the ones with /I. I must have copy-pasted a mixed-up version of my code… correcting it now. Just checked again, my code was correct, seems that you mixed up :slight_smile: just make sure that the variables are declared the same type everywhere

Oups, stupid me I fogot to declare as int.

{
  gStyle->SetOptStat(111111);

  auto c = new TCanvas("c", "c", 1800, 500);
  c->Divide(3,1);
  int x, y, z;

  auto T = new TTree("T","Tree");
  
  T->Branch("x",&x,"x/I");
  T->Branch("y",&y,"y/I");
  T->Branch("z",&z,"z/I");

  for (int i=0; i<50; ++i) {
    x = -999;
    y = -999;
    z = -999;
    T->Fill();
  }
  for (int i=0; i<20; ++i) {
    x = 0;
    y = 1;
    z = -1;
    T->Fill();
  }

  c->cd(1);  T->Draw("x");
  c->cd(2);  T->Draw("y");
  c->cd(3);  T->Draw("z");
}

Gives:

So, for int (which doesn’t show the issue) we get the same. But I see the problem for float and doubles. Do you not get the same plot I got above for float/double?

float:


double:

Ok, the same I get, the plot of x doesn’t show the entries at x=0, they go to the overflow.

I added the following lines in your macro

    T->Draw("x");
    auto htemp = (TH1F *)gPad->GetPrimitive("htemp");
    cout << htemp->GetTitle() << endl;
    cout << htemp->GetXaxis()->GetNbins() << endl;
    cout << htemp->GetXaxis()->GetXmin() << endl;
    cout << htemp->GetXaxis()->GetXmax() << endl;

the output is:

x
100
-1100
0

So you see that the upper limit, defined automatically, is 0. So if you fill at 0 you are and the upper limit of the last bin and it fall in the overflows. You can see the same effect with:

{
   gStyle->SetOptStat(111111);
   auto h = new TH1F("x","x",100,-1100.,0.);
   h->Fill(-1000.);
   h->Fill(-1000.);
   h->Fill(0.);
   h->Fill(0.);
   h->Draw();
}

May be you should define the histograms binning yourself ?

1 Like

I proposed a PR here: [hist] in TTree::Draw, last bin should include vmax values by ferdymercury · Pull Request #17689 · root-project/root · GitHub

1 Like

@couet indeed, that was always a way to avoid it, but my point was that Draw should take care of that, automatically, as proposed in @ferhue 's PR.

This PR unconditionally assumes that the drawn variable’s values have abs(xmax) >> 1e-12 (imagine you draw some variable whose all values are of the order smaller than 1e-12).
Maybe this would do (a single “float” step):
xmax = double(std::nextafter(float(xmax), INFINITY));
or (two “float” steps):
xmax = double(std::nextafter(std::nextafter(float(xmax), INFINITY), INFINITY));

I tried what you meant of using concatenated nextafters but it didn’t work. With 1-e13 it fails. It needs at least 1e-12
It’s true that this is not ideal, but at least it’s a threshold. It will give suboptimal (too large) right margin if x scale is small, but at least it will not hide data.

Ah, this reminds me of a very old bug report …

I think we should ask @moneta about the proposed PR.

1 Like

One-liner reproducer:

TH1F h("h","h", 100, -1000, 1e31*std::nextafter(float(0),INFINITY)); h.Fill(-999); h.Fill(0); h.GetBinContent(100)

If I change to 1e32, it works.

It comes down to this line in TAxis:

bin = 1 + int (fNbins*(x-fXmin)/(fXmax-fXmin) );

so:

int(100*1000./(1000.+1e-13)) is 99
whereas
int(100*1000./(1000.+1e-14)) is 100

Yes, that’s exactly what my previous post talks about.

1 Like

I’ve changed the PR to take into account the scale of the values being drawn.

This topic was automatically closed 14 days after the last reply. New replies are no longer allowed.