It might be you were using an old version of ROOT.
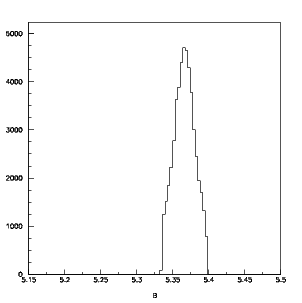
In ROOT, by default, an histogram contaning errors is drawn with error bars if you do
not specify any drawing option. The solutions @Wile_E_Coyote suggested are the right ones.
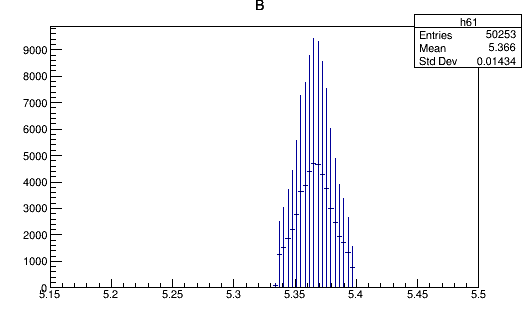
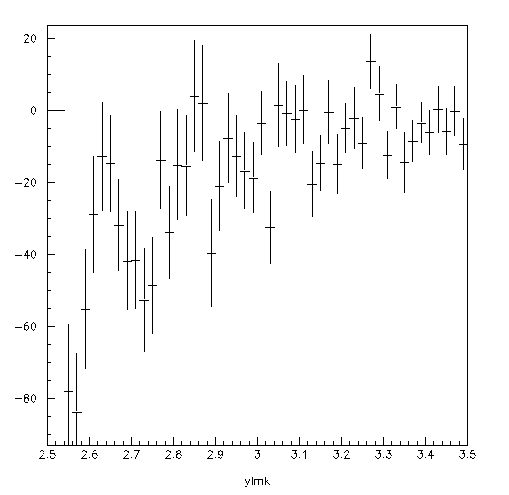
I obtain the correct error bars for normal histograms. However, if I am going to plot histograms with weighted entries, (i.e. produced with the hbarx option) I obtain incorrect results (probably it is still using the sqrt(entries) error)
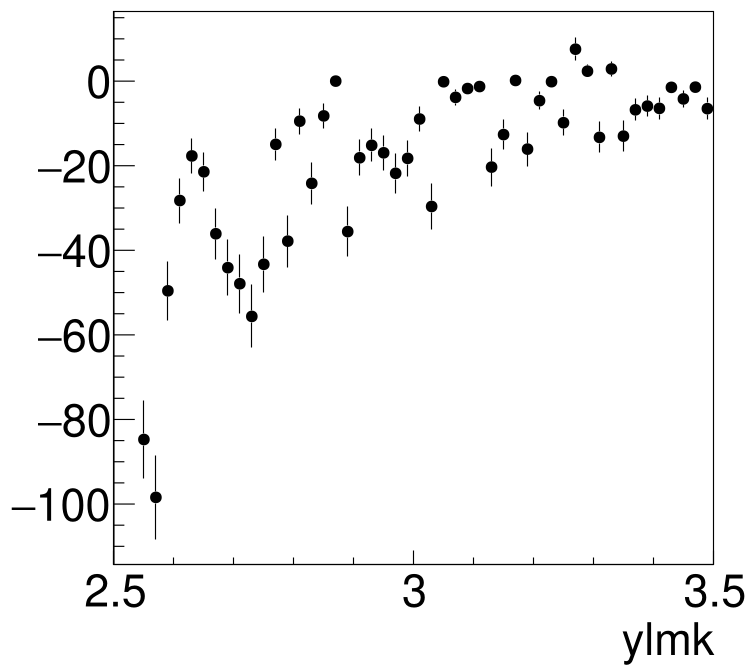
If you used “HBARX”, and/or “HBARY”, and were filling histograms with weights not always equal to 1, and/or used “HOPERA”, then you should not use “Sumw2(kFALSE)”.