I have some problems to find some tutorial explaining how to obtain with ROOSTATS the upper limit plot for production cross-section for example in function of some other parameter like the one attached.
I have found many tutorials having the CLs on the y axis and the POI on the x axis, and indeed I managed to produce this kind of plot for my study. However, it would be helpful for me to understand how to use your tools to obtain a plot like the one attached with the upper limit on the X-section on y axis.
Please, if you have any suggestion let me know,
The idea I got after reading your post is that you are trying to find a way to draw something similar to those green/yellow areas. If my assumption is right, I think @moneta is probably the right person to give some hints on how to do that.
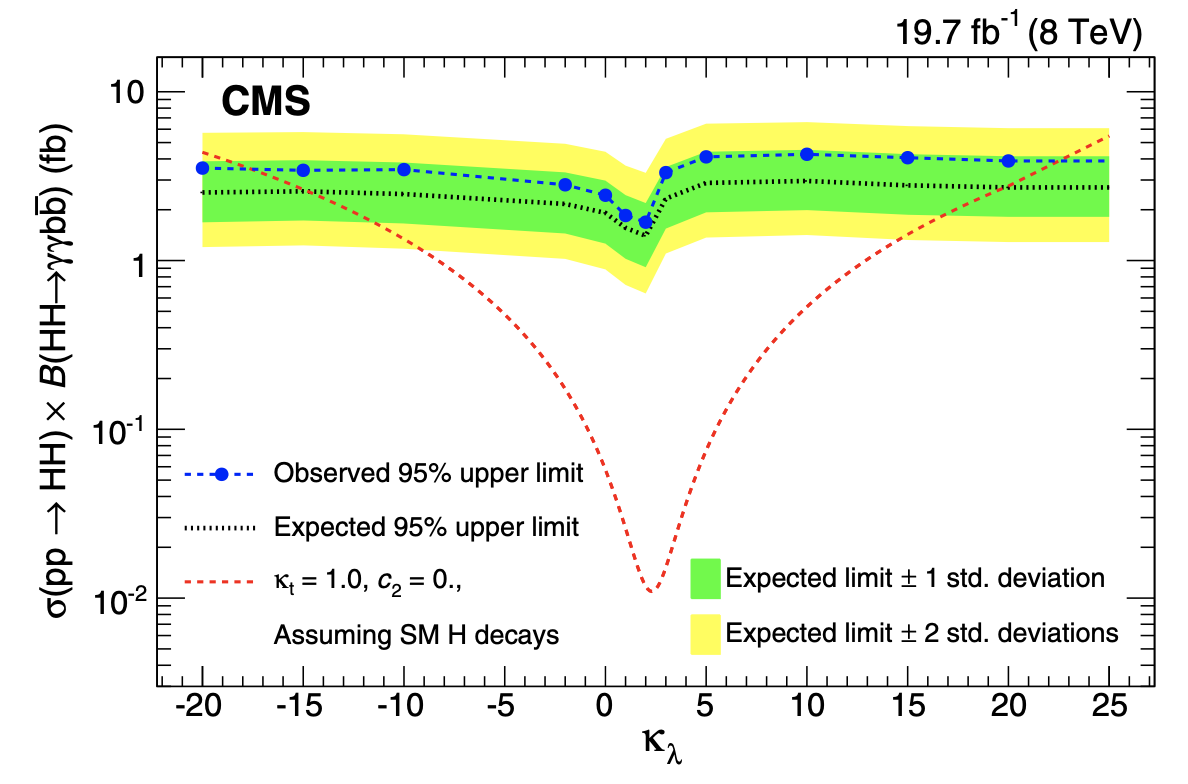
You need to run the limit calculation, such as the one obtained using the StandardHypoTestInvDemo.C macro (see ROOT: tutorials/roostats/StandardHypoTestInvDemo.C File Reference)
on different model parameter points (k(lambda)).
The macro will return for each k(lambda) an observed limit, an expected limit, and the +/- 1,2 sigma expected limits and these you can use as input to your final plot as above.
Unfortunately I don’t have an example for this, I should probably do it for a simple model and add in teh tutorials. There is one example for computing the significance as function of the mass, see https://twiki.cern.ch/twiki/bin/view/RooStats/RooStatsExercisesMarch2015#Exercise_6b_Compute_significance
but in this case is not a limit calculation, but a simple hypothesis test to get the significance.