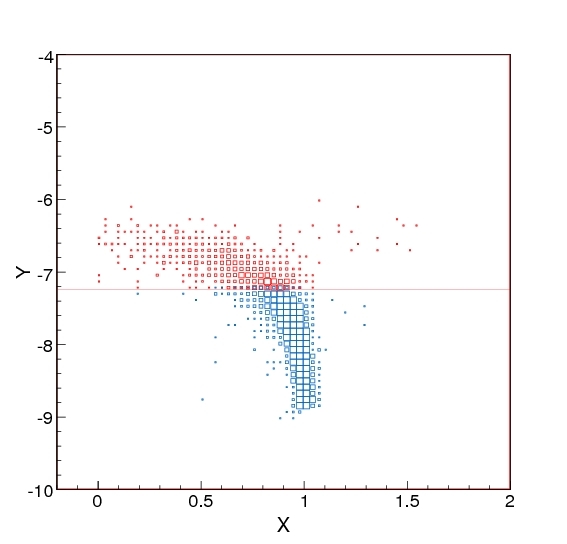
I did a box plot of some scan-generated quantities. The plot
is reported in fig. plotbox.jpg.
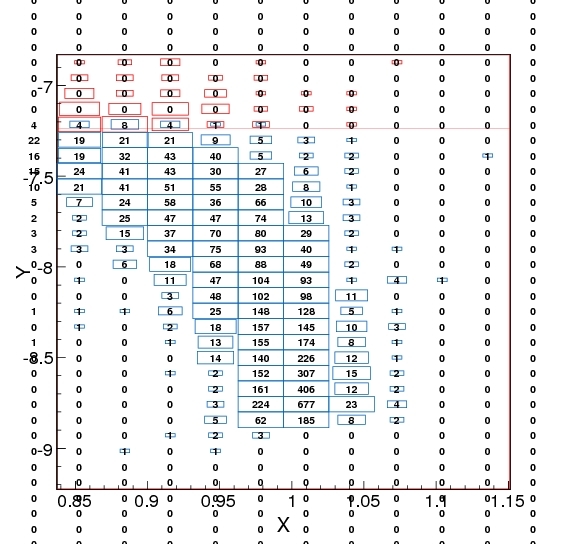
However, if I zoom in and look at the content of the single
boxes, I find that the dimension of the area “saturates” above a
content of roughly 20.
Please have a look at plotbox-zoom.jpg, where a zoom in the most
populated region is reported, with superimposed the content of
each box. As one can see, for a box content exceeding ~ 20,
the dimension of box areas saturates to a maximum value.
I also tried to rescale the box content of the histogram by a
convenient factor, but it still does not seem to work out.
Which setting am I missing?
Many thanks,
D
PS: the red and blue boxes belong to separate histograms.
The zeros superimposed to the red boxes in the zoomed plot actually
refer to the “blue” histogram.
Ok, this explain what you get. When you draw a box plot over an other one using option SAME, the minimum and maximum values along the Z axis (histogram content) are defined by the 1st plot (the one you did without option same). This way the new plot (with option SAME) can be compared with the other one (otherwise it makes no sense). In case the 2nd plot has it limits larger than the 1st one, you get some cut effect. This is exactly the same when you plot a 1D histogram on top of an other using option SAME: If the 2nd one has a maximum larger than the 1st one maximum, then a cut appears. To avoid this you should make sure that the 1st histogram you plot has the largest dynamic in Z.