I plotted one TH1D histogram and one THStack histogram in one pad. I draw THStack first but got an error: attempt to access a null-pointer for
Stack_hist.GetYaxis().SetTitle("A title")
GetYaxis() works for TH1D but not for THStack Object. Does anyone know why and how to fix it?
In addition, the bottom part of histograms is cut off. I saw an old topic suggested to use gStyle->SetHistMinimumZero(kTRUE). How to write it in python? I tried SetMinimum(0) but it is not working. Actually the cut off just appeared when I shortened the variable range, for some unknown reasons.
 for i in range(len(mc)):
                mc[i].SetDirectory(0)
        data.SetDirectory(0)
        histFile.Close()


        for i in range(len(mc)):
                mc[i].SetStats(0)
        data.SetStats(0)

        combine_mc = mc[0].Clone()
        for i in range(1,len(mc)):
                combine_mc.Add(mc[i])
        ratio = data.Clone()
        ratio.Divide(combine_mc)
        ratio.SetMarkerColor(1)
        ratio.SetMarkerStyle(20)
        ratio.SetMarkerSize(0.5)
        ratio.SetLineWidth(1)
        ratio.SetTitle("")
        ratio.GetXaxis().SetTitle(label[k])
        ratio.GetXaxis().SetTitleSize(0.12)
        ratio.GetXaxis().SetLabelSize(0.12)
        ratio.GetYaxis().SetTitleSize(0.11)
        ratio.GetYaxis().SetLabelSize(0.1)
        ratio.GetYaxis().SetTitle("Data / MC")
        ratio.GetYaxis().SetTitleOffset(0.3)
        ratio.GetYaxis().SetRangeUser(0.5,1.5)
        ratio.GetYaxis().SetNdivisions(207)

        total_mc = ROOT.THStack("total_mc","total_mc")
        for i in range(0,len(mc)):
                mc[i].SetFillColor(colors[i])
                mc[i].SetLineColor(colors[i])
                total_mc.Add(mc[i])

        total_mc.SetTitle("")
        total_mc.GetYaxis().SetTitle("Number of events")
        total_mc.GetXaxis().SetLabelSize(0)
        total_mc.GetXaxis().SetTitleSize(0)
        data.SetMarkerColor(1)
        data.SetMarkerStyle(20)
        data.SetMarkerSize(0.5)
        data.SetLineWidth(1)

        canvas.Clear()
        pad1 = ROOT.TPad("pad1","pad1",0,0.3,1,1)
        pad1.SetLogy(True)
        pad1.SetBottomMargin(0)
        pad1.Draw()
        pad1.cd()
        total_mc.Draw("h")
        data.Draw("E X0,same")

        legend = ROOT.TLegend(0.6,0.5,0.85,0.8)
        for i in range(len(mc)):
                legend.AddEntry(mc[i],name[i])
        legend.AddEntry(data,"data")
        legend.SetLineWidth(0)
        legend.Draw("same")

        canvas.cd()
        pad2 = ROOT.TPad("pad2","pad2",0,0.05,1,0.3)
        pad2.SetBottomMargin(0.25)
        pad2.SetTopMargin(0.05)
        pad2.Draw()
        pad2.cd()
        ratio.Draw("pe")

        line = ROOT.TLine(2,1,limit[k],1)
        line.SetLineColor(632)
        line.Draw("same")

        canvas.Print(plotFileName)
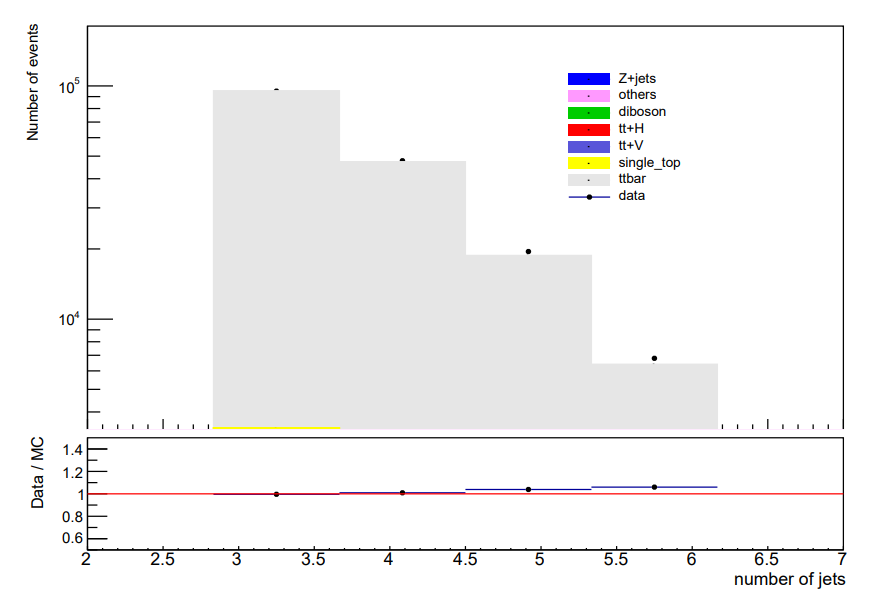
I posted the relevant codes after getting opening canvas and getting histograms from ‘mc’. ‘total_mc’ and ‘data’ are plotted in pad1 and ‘ratio’ is plotted in pad2.
But, now, in code you posted I do not see Stack_hist. One thing you can try is gPad->Update(); (or equivalent in Python) just after the drawing of Stack_hist.
Sorry for your confusion! Stack_hist is just total_mc, only different for name. I tried total_mc.Update() after drawing, but the running was interrupted by the error of null-pointer about GetYaxis(), the line before drawing.
I used total_mc = ROOT.gPad.Update() after drawing and got an error for SetTitle:
AttributeError: ‘NoneType’ object has no attribute ‘SetTitle’
It is interesting that Update() convert ‘THStack’ into ‘NoneType’. Why is that?
For larger Y value, let’s say (0.5, 1), so top 50% canvas is for Pad1. The Y axis is compressed but the histogram is still incomplete. I also tried smaller Y vaule (0.2, 1) to let Pad2 hide the bottom part of Pad1. In this case, the X axis scale is gone, so that means overlap. In the plot of my first message, the X axis scale survives. Thus I don’t think bottom cut off should be attributed to pads overlap.
The plot is acceptable enough when using SetMinimum(1). By the way, it resulted in a crash by SetMinimum(0), only when having Log Scale on Y axis. I appreciate your help! Have a nice day!