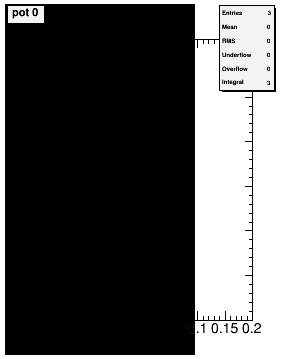
I trying to plot 8 histograms on one canvas, but I am getting black rectangles over almost whole histograms (I put example image into attachement). I have cut out part of the code to reproduce the problem on smaller macro:
[code]#include “TROOT.h”
#include “TStyle.h”
#include “TCanvas.h”
#include “TFile.h”
#include “TString.h”
#include “TH1.h”
#include
void reco_compare_problem_mincode()
{
TObjArray Hlist(0);
TString histname, histitle;
std::ostringstream ss;
// create histograms
TH1F* x_pot_h[8];
for (Int_t i=0; i<8; i++){

	ss.str("");
	ss << i;

	histname = "pot " + ss.str() + ", \\Delta x[mm] ";
	histitle = "pot " + ss.str() + "; \\Delta x[mm]; dN/dx";

	x_pot_h[i] = new TH1F(histname, histitle, 100, -0.2, 0.2);
	Hlist.Add(x_pot_h[i]);
}

// fill histograms
for (Int_t i=0; i<3; i++)
{
	  for (int iPot=0; iPot<8; iPot++){
			x_pot_h[iPot]->Fill(0.0);
		}
}

TFile f("ALFA_control_plots_test.root","recreate");
Hlist.Write();

// draw histograms
TCanvas *c4 = new TCanvas("c4","Root Canvas",1200,760);
c4->Divide(4,2);
gStyle->SetOptStat(1111110);

c4->cd(1);
x_pot_h[0]->Draw();
c4->cd(2);
x_pot_h[2]->Draw();
c4->cd(3);
x_pot_h[4]->Draw();
c4->cd(4);
x_pot_h[6]->Draw();
c4->cd(5);
x_pot_h[1]->Draw();
c4->cd(6);
x_pot_h[3]->Draw();
c4->cd(7);
x_pot_h[5]->Draw();
c4->cd(8);
x_pot_h[7]->Draw();

f.Close();
}[/code]
The rectangles are present in both canvas and histograms stored in the file.
I am running under Atlas Offline (Athena) 19.0.2 on lxplus, I have tried other versions, without change. The problem seems to be related/caused by my style settings in rootlogon.c:
{// Add my own options here:
TStyle* mcStyle = new TStyle("mcStyle","Custom style");
mcStyle->SetPalette(1,0); // avoid horrible default color scheme
mcStyle->SetOptDate(0);
mcStyle->SetLabelSize(15,"xyz"); // size of axis value font
mcStyle->SetTitleSize(16,"xyz"); // size of axis title font
mcStyle->SetTitleFont(43,"xyz"); // font option
mcStyle->SetLabelFont(43,"xyz");
mcStyle->SetTitleOffset(2,"xy");
// default canvas options
mcStyle->SetCanvasDefW(500);
mcStyle->SetCanvasDefH(500);
mcStyle->SetCanvasColor(0); // canvas...
mcStyle->SetCanvasBorderMode(0);
mcStyle->SetCanvasBorderSize(0);
mcStyle->SetPadGridX(0); // grids, tickmarks
mcStyle->SetPadGridY(0);
mcStyle->SetPadTickX(1);
mcStyle->SetPadTickY(1);
mcStyle->SetPadBorderMode(0);
mcStyle->SetPadColor(0);
mcStyle->SetFrameBorderMode(0);
gROOT->SetStyle("mcStyle");
cout << "Styles are Set!" << endl;
return;
}
However, I do not see the problem.
Strange is, this happens only to some sets of histograms (the first few being drawn).