Good morning,
I use THStack to combine 7 histograms, but after combining for some reason, events appear that were not there. Code:
TFile *f0 = new TFile ("/home/slava/Data_Files/root/Var1/4009.root");
TFile *f1 = new TFile ("/home/slava/Data_Files/root/Var1/4210.root");
TFile *f2 = new TFile ("/home/slava/Data_Files/root/Var1/4230.root");
TFile *f3 = new TFile ("/home/slava/Data_Files/root/Var1/4260.root");
TFile *f4 = new TFile ("/home/slava/Data_Files/root/Var1/4360.root");
TFile *f5 = new TFile ("/home/slava/Data_Files/root/Var1/4470.root");
TFile *f6 = new TFile ("/home/slava/Data_Files/root/Var1/4600.root");
TH2D *his4009 = (TH2D*)f0->Get("momentum_and_energy_p/Energy_point");
TH2D *his4210 = (TH2D*)f1->Get("momentum_and_energy_p/Energy_point");
TH2D *his4230 = (TH2D*)f2->Get("momentum_and_energy_p/Energy_point");
TH2D *his4260 = (TH2D*)f3->Get("momentum_and_energy_p/Energy_point");
TH2D *his4360 = (TH2D*)f4->Get("momentum_and_energy_p/Energy_point");
TH2D *his4470 = (TH2D*)f5->Get("momentum_and_energy_p/Energy_point");
TH2D *his4600 = (TH2D*)f6->Get("momentum_and_energy_p/Energy_point");
his4009->SetMarkerStyle(21);
his4009->SetMarkerColor(2);
his4210->SetMarkerStyle(21);
his4210->SetMarkerColor(3);
his4230->SetMarkerStyle(21);
his4230->SetMarkerColor(4);
his4260->SetMarkerStyle(21);
his4260->SetMarkerColor(5);
his4360->SetMarkerStyle(21);
his4360->SetMarkerColor(6);
his4470->SetMarkerStyle(21);
his4470->SetMarkerColor(7);
his4600->SetMarkerStyle(21);
his4600->SetMarkerColor(12);
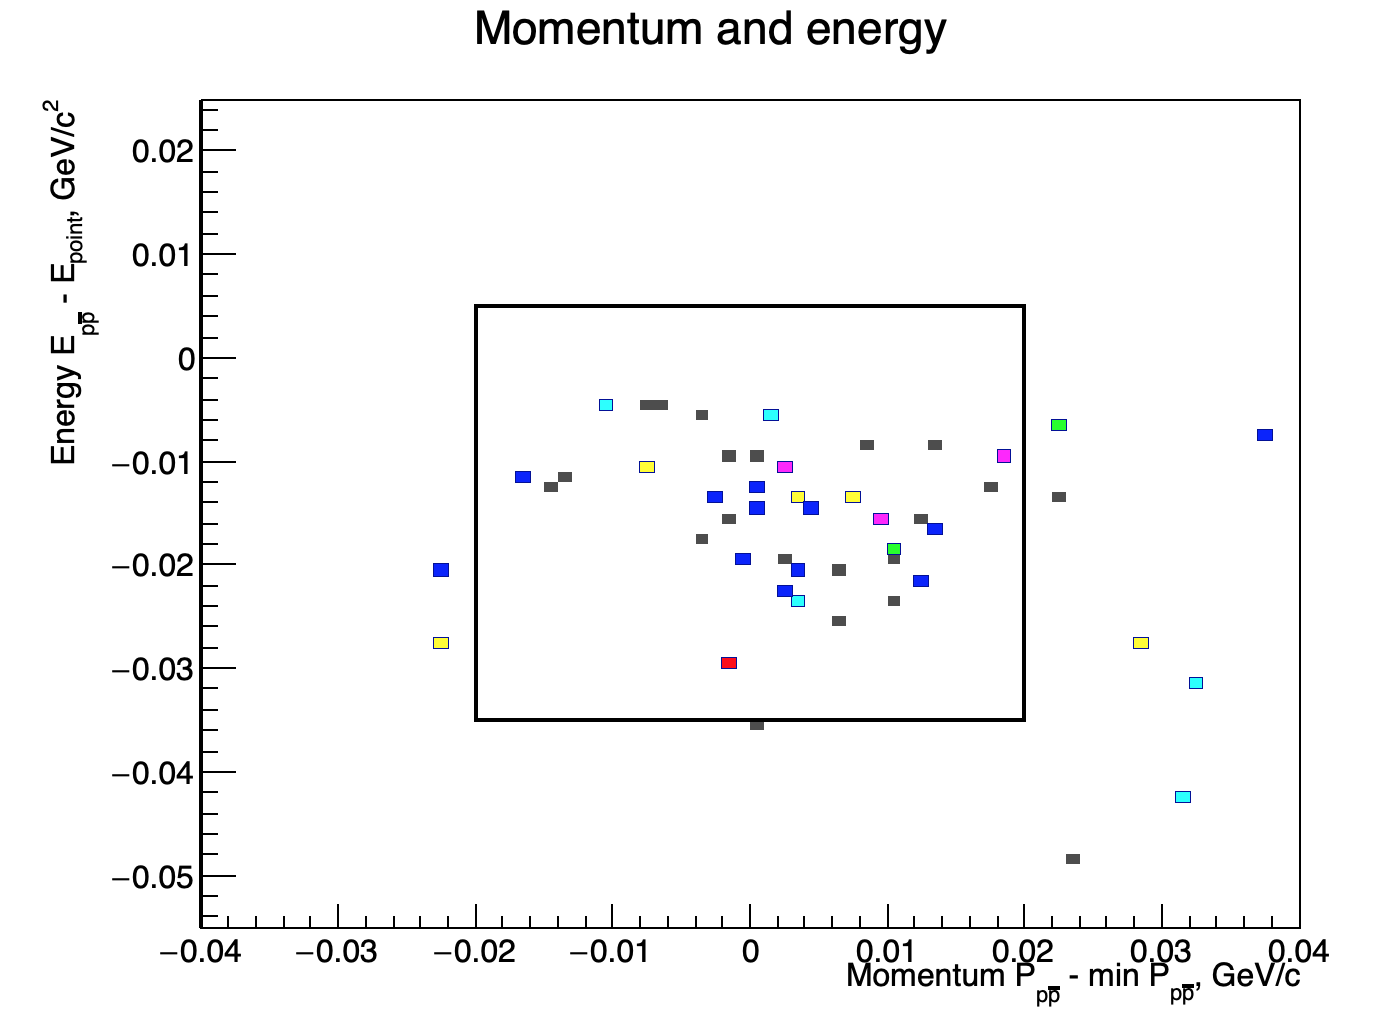
THStack *stack = new THStack("stack","Momentum and energy;Momentum P_{p#bar{p}} - min P_{p#bar{p}}, GeV/c;Energy E_{p#bar{p}} - E_{point}, GeV/c^{2}");
stack->Add(his4009);
stack->Add(his4210);
stack->Add(his4230);
stack->Add(his4260);
stack->Add(his4360);
stack->Add(his4470);
stack->Add(his4600);
stack->Draw("nostack");
Please read tips for efficient and successful posting and posting code
ROOT Version: 6.19/01Platform: Ubuntu
couet
May 19, 2020, 7:42am
2
Difficult to tell what’s wrong without the data.
Data.
4009.root (9.1 KB) 4210.root (9.1 KB) 4230.root (9.6 KB) 4260.root (9.4 KB) 4360.root (9.4 KB) 4470.root (9.2 KB) 4600.root (9.7 KB)
So, a small trial is here:
  // ...
  TCanvas *c = new TCanvas("c", "c");
  c->Divide(3, 3);
  c->cd(1); his4009->Draw();
  c->cd(2); his4210->Draw();
  c->cd(3); his4230->Draw();
  c->cd(4); his4260->Draw();
  c->cd(5); his4360->Draw();
  c->cd(6); his4470->Draw();
  c->cd(7); his4600->Draw();
  c->cd(8); stack->Draw("box");
  c->cd(9); stack->Draw("nostack");
  c->cd(0);
  // ...
@couet It seems that if one “resizes” the canvas then indeed something strange happens in the very last pad.
couet
May 19, 2020, 8:41am
5
The Box you have in your histograms is on purpose ?
root [5] his4009->GetListOfFunctions()->ls()

OBJ: TList TList Doubly linked list : 0

TBox X1= -0.016189 Y1=-0.034895 X2=0.019914 Y2=0.000263

OBJ: TPaveStats stats X1= 0.028000 Y1=0.004500 X2=0.048000 Y2=0.028500`
The problem is not related to these boxes. You can try to add:his4009->GetListOfFunctions()->Delete();
couet
May 19, 2020, 8:56am
7
this seems ok for me
{
   TFile *f0 = new TFile ("4009.root");
   TFile *f1 = new TFile ("4210.root");
   TFile *f2 = new TFile ("4230.root");
   TFile *f3 = new TFile ("4260.root");
   TFile *f4 = new TFile ("4360.root");
   TFile *f5 = new TFile ("4470.root");
   TFile *f6 = new TFile ("4600.root");

   TH2D *his4009 = (TH2D*)f0->Get("momentum_and_energy_p/Energy_point");
   TH2D *his4210 = (TH2D*)f1->Get("momentum_and_energy_p/Energy_point");
   TH2D *his4230 = (TH2D*)f2->Get("momentum_and_energy_p/Energy_point");
   TH2D *his4260 = (TH2D*)f3->Get("momentum_and_energy_p/Energy_point");
   TH2D *his4360 = (TH2D*)f4->Get("momentum_and_energy_p/Energy_point");
   TH2D *his4470 = (TH2D*)f5->Get("momentum_and_energy_p/Energy_point");
   TH2D *his4600 = (TH2D*)f6->Get("momentum_and_energy_p/Energy_point");

   his4009->SetFillColor(2);
   his4210->SetFillColor(3);
   his4230->SetFillColor(4);
   his4260->SetFillColor(5);
   his4360->SetFillColor(6);
   his4470->SetFillColor(7);
   his4600->SetFillColor(12);
   THStack *stack = new THStack("stack","Momentum and energy;Momentum P_{p#bar{p}} - min P_{p#bar{p}}, GeV/c;Energy E_{p#bar{p}} - E_{point}, GeV/c^{2}");

   stack->Add(his4009);
   stack->Add(his4210);
   stack->Add(his4230);
   stack->Add(his4260);
   stack->Add(his4360);
   stack->Add(his4470);
   stack->Add(his4600);

   stack->Draw("box");
}
Try to draw it with “NOSTACK” (that’s where the problem appears) and then try to resize the canvas with a mouse.
couet
May 19, 2020, 9:03am
9
When you draw without a real drawing option.( “nostack” is not a drawing option). Then the 2d histogram is drawn as a scatter plot … ie: random points in the bins …
That’s o.k. wih me.
couet
May 19, 2020, 9:55am
11
The following macro shows the effect better. Some blue point appear behind the red ones on the right pad when enlarging the canvas.
{
   TFile *f1 = new TFile ("4210.root");
   TFile *f5 = new TFile ("4470.root");

   TH2D *his4210 = (TH2D*)f1->Get("momentum_and_energy_p/Energy_point");
   TH2D *his4470 = (TH2D*)f5->Get("momentum_and_energy_p/Energy_point");

   his4210->SetMarkerStyle(21);
   his4210->SetMarkerColor(kRed);

   his4470->SetMarkerStyle(21);
   his4470->SetMarkerColor(kBlue);

   THStack *stack = new THStack("stack","stack");

   stack->Add(his4210);
   stack->Add(his4470);

   TCanvas *c = new TCanvas("c", "c");
   c->Divide(2, 1);

   c->cd(1);
   his4210->Draw();
   his4470->Draw("same");

   c->cd(2);
   stack->Draw("nostack");
}