I am trying to fit data using two templates derived from simulations. The script that I am using works well when bin size is uniform. When one uses variable binning, the components of the pdfs have strange shapes. I have attached the script I am using along with tdrstyle and CMSStyle_lumi that are used in the macro.
HI @Bhargav_Joshi, welcome and thanks for asking your question on the ROOT forum!
The your fit with the variable bin size works just fine and you get the correct fit result, the problem is the plotting. Maybe we will change the plotting behavior in the coming ROOT releases, but for now the problem and a workaround is this:
When creating a RooHistPdf, the given histogram counts are interpreted as event counts. So to get the probability densities, the counts are divided by the bin volumes. This doesn’t make a difference when the binning is uniform, but in the non-uniform case you have an inconsistency when plotting a RooHistPdf together with data: the data is an actual number of events, and the pdf represents the expected number of events per bin volume.
A possible workaround is this: create another RooFit object that is analogous to your model, but use RooHistFunc instead of RooHistPdf. Like this, you don’t get the bin volume correction in the plotting.
In practice, it means you have to replace these lines in the script:
  // Create a function that mirrors the PDF model, but instead of
  // RooHistPdf it uses RooHisFunc.  Like this, the histogram
  // counts are interpreted as event counts and not densities,
  // which is what we want for the plot.
  RooHistFunc func_prompt("func_prompt", "func_prompt", x, prompt);
  RooHistFunc func_non_prompt(
          "func_non_prompt", "func_non_prompt", x, non_prompt);

  RooRealVar coef_non_prompt{
      "coef_non_prompt", "coef_non_prompt",
          fraction.getVal() / non_prompt.sum(false)};

  RooRealVar coef_prompt{
      "coef_prompt", "coef_prompt",
          (1 - fraction.getVal()) / prompt.sum(false)};

  RooRealSumFunc func("func", "func",
          {func_non_prompt, func_prompt},
          {coef_non_prompt, coef_prompt});

  // Now plot the function instead of ther model.
  double nData = data.sumEntries();
  func.plotOn(fitFrame, LineStyle(kDashed),
          Normalization(nData));
  func_prompt.plotOn(fitFrame, LineColor(kGreen),
          Normalization(nData * coef_prompt.getVal()));
  func_non_prompt.plotOn(fitFrame, LineColor(kBlue),
          Normalization(nData * coef_non_prompt.getVal()));
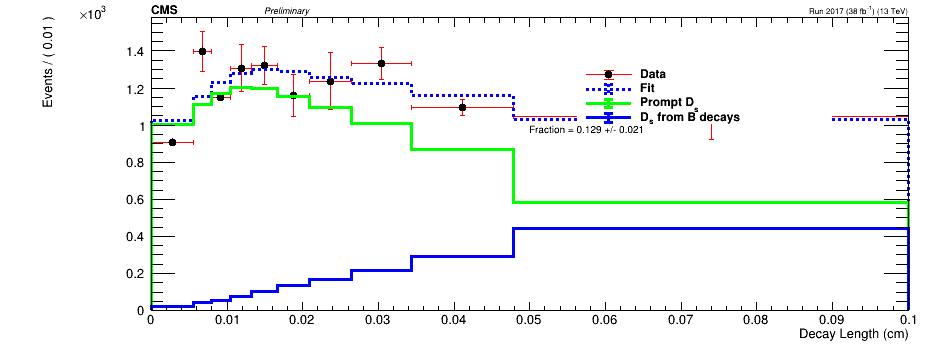
It’s a bit more verbose because you have to normalize the functions yourself and the RooRealSumFunc doesn’t support the Components command argument when plotting. However, the plot now looks correct:
I hope this workaround is fine for you for now, and sorry that RooFit has trouble with variable bin widths! I have opened a GitHub issue to remind myself that this needs to be worked on: