Dear RooFit experts,
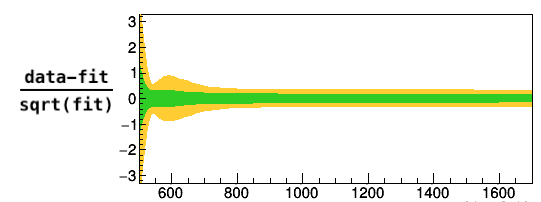
I perform a fit of data to a pdf stored in RooWorkspace. The fit seems to converge fine (see Code and Output from fit below). When plotting the 1- and 2-sigma bands for (data-fit)/sqrt(fit) one can observe a structure for the 2-sigma band (see attached figure). From the linear method for error band visualisation wouldn’t one expect the 2-sigma band to be approximate 2 times the 1 sigma band, considering that it uses the correlation matrix and linear and gaussian approximations? What could be wrong in the fit that could produce such behaviour?
Thanks for any help!
Best,
Rob
Code
   const char * sr3 = "500,1700";

   TFile *f = new TFile("FitContainer_workspace.root") ;
   RooWorkspace* w = (RooWorkspace*) f->Get("workspace") ;

   RooRealVar* x = w->var("mbb") ;
   RooAbsData* data = w->data("data_container") ;
   RooAbsPdf* model = w->pdf("background") ;

   data -> SetName("data");
   model -> SetName("model");

   RooNLLVar nll("nll","nll",*model,*data,Range(sr3));

   RooMinimizer m(nll);
   m.setMinimizerType("Minuit2");
   m.setOffsetting(true);
   m.setEps(1e-09);
   m.optimizeConst(kTRUE);
   m.minimize("Minuit2","minimize") ;
   m.hesse();

   RooFitResult * newfr = m.save();

   // Plot data and PDF overlaid
   RooPlot* xframe = x->frame(Title("Plot in control region SR3")) ;
   data->plotOn(xframe,Name("data_plot")) ;
   model->plotOn(xframe,VisualizeError(*newfr, 2, true),Range(sr3),FillColor(kOrange),Name("model_2sig_plot"));
   model->plotOn(xframe,VisualizeError(*newfr, 1, true),Range(sr3),FillColor(kGreen+1),Name("model_1sig_plot"));
   model->plotOn(xframe,Range(sr3),Name("model_plot"));

   // Draw the frame on the canvas
   TCanvas * c1 = new TCanvas("c1","",600,600);
   xframe->Draw();
Output from fit
[#1] INFO:Fitting -- RooAbsOptTestStatistic::ctor(nll) constructing test statistic for sub-range named 500,1700
[#1] INFO:Eval -- RooRealVar::setRange(mbb) new range named 'NormalizationRangeFor500,1700' created with bounds [500,1700]
[#1] INFO:Eval -- RooRealVar::setRange(mbb) new range named 'fit_nll' created with bounds [500,1700]
[#1] INFO:Fitting -- RooAbsOptTestStatistic::ctor(nll) fixing interpretation of coefficients of any RooAddPdf to full domain of observables
[#1] INFO:Minization -- RooMinimizer::optimizeConst: activating const optimization
Minuit2Minimizer: Minimize with max-calls 1500 convergence for edm < 1e-09 strategy 1
[#1] INFO:Minization -- RooNLLVar::evaluatePartition(nll) first = 0 last = 25686 Likelihood offset now set to 152145
MnSeedGenerator: for initial parameters FCN = 2.910383045673e-11
MnSeedGenerator: Initial state:   - FCN = 2.910383045673e-11 Edm =     0.388614 NCalls =     13
VariableMetric: start iterating until Edm is < 1.19209e-10
VariableMetric: Initial state   - FCN = 2.910383045673e-11 Edm =     0.388614 NCalls =     13
VariableMetric: Iteration #   0 - FCN = 2.910383045673e-11 Edm =     0.388614 NCalls =     13
VariableMetric: Iteration #   1 - FCN = -0.1326178522722 Edm =  0.000567549 NCalls =     23
VariableMetric: Iteration #   2 - FCN = -0.1505190411699 Edm =  0.000406879 NCalls =     33
VariableMetric: Iteration #   3 - FCN = -0.1515335320437 Edm =  0.000548681 NCalls =     41
VariableMetric: Iteration #   4 - FCN = -0.1600214548816 Edm =  0.000213068 NCalls =     51
VariableMetric: Iteration #   5 - FCN = -0.1602634708688 Edm =  2.27962e-06 NCalls =     59
VariableMetric: Iteration #   6 - FCN = -0.1602659696946 Edm =  3.84508e-09 NCalls =     67
VariableMetric: Iteration #   7 - FCN =   -0.16026597374 Edm =  6.66839e-12 NCalls =     79
VariableMetric: After Hessian   - FCN =   -0.16026597374 Edm =  7.61914e-12 NCalls =     95
VariableMetric: Iteration #   8 - FCN =   -0.16026597374 Edm =  7.61914e-12 NCalls =     95
Minuit2Minimizer : Valid minimum - status = 0
FVAL  = -0.160265973740024492
Edm   = 7.61913562375430122e-12
Nfcn  = 95
peak1	  = 418.272	 +/-  38.7799	(limited)
tail	  = -0.884917	 +/-  0.0375686	(limited)
width1	  = 60.9582	 +/-  1.88314	(limited)
Info in <Minuit2>: Minuit2Minimizer::Hesse : Hesse is valid - matrix is accurate
The command
newfr -> printValue(cout);
returns
(status=0,FCNmin=-0.160266,EDM=2.00469e-11,covQual=3)