Hello again @j.d.frankland !
I’ve explored the topic for some time and came down to several options depending on what are you trying to achieve.
Introduction
Let A be quantity of interest which can’t be observed directly.
Instead some measurement procedure yields observable X.
The question is what can be inferred about A from series of iid observations \{X_i\}.
All information about connection between X and A is encoded in conditional probability distribution f_{X \mid A = a}(x) which I will also call detector response function.
If it is fully known, like specified in your code
f_{X \mid A = a}(x) = \frac{1}{\sqrt{2 \pi} \times \sigma(a)} e^{- \frac{1}{2} \left( \frac{x - x_0(a)}{s_0(a)} \right)^2} \quad\quad(1)
with x_0 = 8 A - 4, s_0(A) = (A + 1)/2, then it is relatively straightforward exercise.
You, however, state that f_{X \mid A = a}(x) is not known a priori and must be estimated from Monte-Carlo, with possibly flat prior on A used for estimate
\hat{f}_{X \mid A = a}(x) = \frac{\hat{f}_{X, A}(x, a)}{\hat{f}_A(a)} \quad\quad(2).
Choice of prior might be different, for example, to prioritize lower efficiency regions in parameter space to achieve more uniform systematic error.
I suggest three analysis options, which is by no means a comprehensive list, and actual choice strongly depends on context of your research.
I must say that I couldn’t implement the first two of them in RooFit, facing technical issues.
The third option, unfolding, requires not RooFit but RooUnfold or other tool.
Also, I didn’t very rigorously check all the math, so further claims about distribution convergence should be taken with grain of salt.
Analysis choices
1. Simple model, detector response fit
Detector response is assumed to have functional form (1) with parameters fit from Monte-Carlo.
True A distribution is believed to be
f_{A}(a) = \delta(a - a_0) .
If in reality it is different, then this method will fail to deliver sound results due to model misspecification.
Bayesian inference is valid and iteratively updated posteriors
f_{A \mid X_1 = x_1, \dotsc X_n = x_n}(a) \propto f_{X \mid A=a}(x_n) f_{A \mid X_1 = x_1, \dotsc X_{n-1} = x_{n-1}}(a)
converge to \delta(a - a_0).
2. Hierarchical model, detector response fit
Detector response is assumed to have functional form (1) with parameters fit from Monte-Carlo.
True A distribution is believed to belong to some parametric family, e. g.
f_{A \mid \mu_A = \mu_0, \sigma_A = \sigma_0}(a) = \frac{1}{\sqrt{2 \pi} \times \sigma_0} e^{- \frac{1}{2} \left( \frac{a - \mu_0}{\sigma_0} \right)^2}
where \mu_A and \sigma_A are so-called hyperparameters describing distribution of A.
Each measurement X_i is taken with an independent realization A_i.
Bayesian inference is valid if model is correctly specified, namely, given full prior
f_{A, \mu_A, \sigma_A}(a, \mu, \sigma) = f_{A \mid \mu_A = \mu, \sigma_A = \sigma}(a) f_{\mu_A, \sigma_A}(\mu, \sigma)
iteratively updated full posteriors
f_{A, \mu_A, \sigma_A \mid X_1 = x_1, \dotsc X_n = x_n}(a, \mu, \sigma) \propto f_{X_n \mid A = a}(x_n) f_{A, \mu_A, \sigma_A \mid X_1 = x_1, \dotsc X_{n-1} = x_{n-1}}(a, \mu, \sigma)
converge to
f_{A \mid \mu_A = \mu_0, \sigma_A = \sigma_0}(a) \delta(\mu - \mu_{0}) \delta(\sigma - \sigma_{0}) .
And marginal posterior
f_{A \mid X_1 = x_1, \dotsc X_n = x_n}(a) = \int f_{A, \mu_A, \sigma_A \mid X_1 = x_1, \dotsc X_n = x_n}(a, \mu, \sigma) d\mu d\sigma
converges to f_{A \mid \mu_A = \mu_0, \sigma_A = \sigma_0}.
3. Unfolding
No assumptions are held about true A distribution (except quite general like smoothness), and its estimate \hat{f}_A is obtained from the data by solving equation
\hat{f}_{X}(x) = \int \hat{f}_{X \mid A = a}(x) \hat{f}_A(a) d a
where \hat{f}_{X} is some empirical estimate of marginal X pdf and \hat{f}_{X \mid A = a} is estimated from Monte-Carlo simulations via (2).
Usual approach is to use histograms instead of pdfs, so the problem boils down to matrix equation
h_{X, i} = \sum_j M_{i j} h_{A, j}
where h_{X, i}, h_{A, j} are bin contents of corresponding histograms and M_{i j} is detector response matrix.
It might be tempting to just find inverse, M^{-1}, but D’Agostini argues in his seminal paper that it is not a simple linear algebra problem but probability theory problem requiring other appropriate tools.
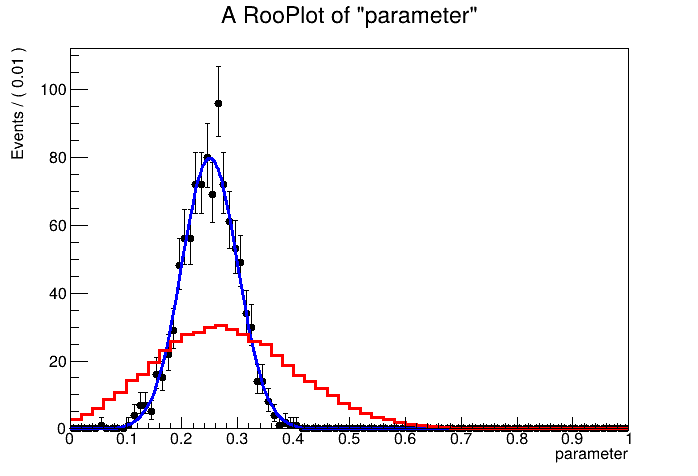
Test attempt
I’ve attempted to implement at least the first approach with simple model using RooFit’s BayesianCalculator, but failed due to obscure error.
Perhaps its resolution should belong to a separate thread.
Here is the script
Macro based on code provided by j.d.frankland
void test_RooFit_Bayesian() {
RooAbsPdf::defaultIntegratorConfig()->setEpsRel(1e-3);
RooAbsPdf::defaultIntegratorConfig()->setEpsAbs(1e-3);
// --------------------------------------------------------------------------
// Get detector response estimate as histogram h_mod
int bins_obs = 50;
int bins_par = 50;
auto h_mod = new TH2D("h_mod", "Model", bins_par, 0.0, 1.0, bins_obs, -5.0, 5.0);
double p0{8.0}, p1{4.0}, p2{1.0}, p3{0.5};
auto mod_f2 = new TF2("mod_f2", [](double * x, double * p)
{
auto A = x[0];
auto X = x[1];
// return TMath::Gaus(X, 8.0 * A - 4, (A + 1) * 0.5);
return p[4] * TMath::Gaus(X, p[0] * A - p[1], (A + p[2]) * p[3], true);
}, 0.0, 1.0, -5.0, 5.0, 5);
mod_f2->SetParameter(0, p0);
mod_f2->SetParLimits(0, 6.0, 10.0);
mod_f2->SetParameter(1, p1);
mod_f2->SetParLimits(1, 2.0, 6.0);
mod_f2->SetParameter(2, p2);
mod_f2->SetParLimits(2, 0.5, 1.5);
mod_f2->SetParameter(3, p3);
mod_f2->SetParLimits(3, 0.3, 0.7);
mod_f2->SetParameter(4, 1.0);
mod_f2->SetParName(4, "norm");
auto N = 100000;
h_mod->FillRandom("mod_f2", N);
// h_mod->Draw("col");
auto c1 = new TCanvas("c1");
// --------------------------------------------------------------------------
// Fit to get continuous detector response using same mod_f2
// pretend that we don't know true mod_f2 parameters
// assuming that mod_f2 includes flat prior on A, integral over X yields p[4]
// then integral over A still yields p[4]
mod_f2->FixParameter(4, N);
h_mod->Scale(1.0 / h_mod->GetXaxis()->GetBinWidth(1) / h_mod->GetYaxis()->GetBinWidth(1));
auto fit_result = h_mod->Fit(mod_f2, "LEM QS");
fit_result->Print("V");
// import model histogram
RooRealVar A("A", "parameter", 0., 1.);
RooRealVar X("X", "observable", -5., 5.);
RooDataHist rdh_model("rdh_model", "rdh_model", RooArgList(A, X), RooFit::Import(*h_mod));
RooHistPdf model("model", "2D histo as PDF", RooArgList(A, X), rdh_model);
// auto hh_pdf = model.createHistogram("A,X", 50, 50);
// hh_pdf->Draw("surf");
// max value seems to be around 0.0025
// --------------------------------------------------------------------------
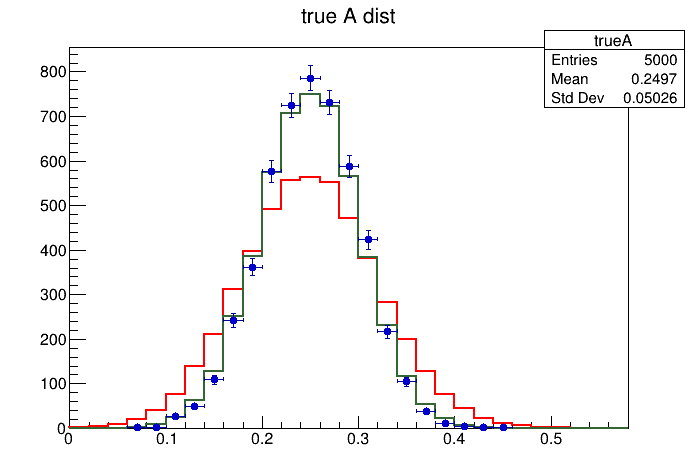
// generate pseudo-data from gaussian distribution of A
// Note that this is hierarchical model, and simple model should fail
RooRealVar mean("mean", "mean", 0.25, -5.0, 5.0);
RooRealVar sigma("sigma", "sigma", 0.14, 1e-6, 100);
RooGaussian gaussA("gaussA",
"Gaussian parameter distribution",
A, mean, sigma
);
RooProdPdf data_model("data_model", "Product PDF to make pseudo-data", gaussA, RooFit::Conditional(model, X));
// can't set _maxFuncVal during generation to fix warning!
// Generate events in A and X from model
std::unique_ptr<RooDataSet> dati{data_model.generate({A, X}, 100)};
// auto hh_pdf2 = dati->createHistogram(A, X, 50, 50);
// hh_pdf2->Draw("surf");
auto dati_X = dati->reduce(RooArgSet(X));
auto dati_A = dati->reduce(RooArgSet(A));
// --------------------------------------------------------------------------
// 1. Simple model (should fail in theory due to model misspecification against data_model)
// Flat prior on A, as A was created with limits [0, 1],
// RooUniform should automatically be in correct limits
RooUniform priorA_SimpleModel("priorA_SimpleModel", "Flat prior on A", RooArgSet(A));
// to suppress messages when pdf goes to zero
RooMsgService::instance().setGlobalKillBelow(RooFit::FATAL);
double confLevel = 0.90;
double test_size = 1. - confLevel;
RooStats::BayesianCalculator bcalc_SimpleModel(*dati_X, model, RooArgSet(A), priorA_SimpleModel);
bcalc_SimpleModel.SetTestSize(test_size);
RooPlot *plot = bcalc_SimpleModel.GetPosteriorPlot();
// Can't run macro
/*
input_line_222:2:89: error: expected expression
Double_t TFormula____id6161329700811859975(Double_t const *x){ return TMath::Exp(-x[0]+-{nan}) ; }
^
input_line_223:2:89: error: expected expression
Double_t TFormula____id6161329700811859975(Double_t const *x){ return TMath::Exp(-x[0]+-{nan}) ; }
^
Error in <prepareMethod>: Can't compile function TFormula____id6161329700811859975 prototype with arguments Double_t const*
Error in <TFormula::InputFormulaIntoCling>: Error compiling formula expression in Cling
Error in <TFormula::ProcessFormula>: "nan" has not been matched in the formula expression
Error in <TFormula::ProcessFormula>: Formula "exp(-x[0]+-nan)" is invalid !
[#0] FATAL:InputArguments -- RooFormula 'likelihood_times_prior_product_model_priorA_SimpleModel' did not compile or is invalid.
Input:
exp(-@0+-nan)
Passed over to TFormula:
exp(-x[0]+-nan)
Error in <TRint::HandleTermInput()>: std::runtime_error caught: RooFormula 'likelihood_times_prior_product_model_priorA_SimpleModel' did not compile or is invalid.
Input:
exp(-@0+-nan)
Passed over to TFormula:
exp(-x[0]+-nan)
*/
plot->Draw();
}
Discussion
I’ve followed BayesianCalculator tutorial and anticipated that it would be straightforward to implement approaches 1 and 2.
However, I’ve faced technical difficulties in doing so, as my macro fails with some error when trying to use BayesianCalculator.
In principle I think those approaches might be implemented somehow without this class using basic RooFit functionality, but this might turn out to be bulky.
The third option, unfolding, is quite complex and rich topic on its own, and RooFit seemingly doesn’t have means to perform it.
I’ve already mentioned RooUnfold as more appropriate tool, but I can’t really help with it.
RooUnfold is not a built in part of ROOT but a separate package as of now.
The forum has a couple of threads regarding RooUnfold, where you can find RooUnfold experts contacts.
https://root-forum.cern.ch/t/a-question-about-roounfolding-way/53057
https://root-forum.cern.ch/t/using-roounfoldspec-class/60133
I hope that my answer will be helpful!
References and useful links
- https://vioshyvo.github.io/Bayesian_inference/hierarchical-models.html
- G. D’Agostini, Improved iterative Bayesian unfolding
- K. Bierwagen, Bayesian Unfolding
- T. Adye, Unfolding with RooUnfold