Basic questions about Histfactory

Dear expert,

I recently started to work with Histfactory. I try to write simple code and test the functions of Histfactory. My code to make a workspace is

	// data
	TH1F* data_hist = new TH1F("data_hist", "data_hist", 2, 0, 2);
	for (int i = 0; i < 10000; i++) data_hist->Fill(0.5,0.01);
	for (int i = 0; i < 1000; i++) data_hist->Fill(1.5, 0.1);

	// MC signal pdf
	TH1F* Signal = new TH1F("Signal", "Signal", 2, 0, 2);
	Signal->SetBinContent(1, 10);
	Signal->SetBinContent(2, 80);

	TH1F* Signal_up = new TH1F("Signal_up", "Signal_up", 2, 0, 2);
	Signal_up->SetBinContent(1, 12);
	Signal_up->SetBinContent(2, 84);
	Signal_up->Add(Signal, -1.0);

	TH1F* Signal_down = new TH1F("Signal_down", "Signal_down", 2, 0, 2);
	Signal_down->SetBinContent(1, 7);
	Signal_down->SetBinContent(2, 81);
	Signal_down->Add(Signal, -1.0);

	// MC Background pdf
	TH1F* Background1 = new TH1F("Background1", "Background1", 2, 0, 2);
	Background1->SetBinContent(1, 20);
	Background1->SetBinContent(2, 20);


	// work space

	// set data
	HistFactory::Data data;
	data.SetHisto(data_hist);

	// add measurement
	HistFactory::Measurement meas("MyAnalysis");
	meas.SetPOI("mu");
    meas.SetLumi(1.0);
    meas.AddConstantParam("Lumi");

	// add channel
	HistFactory::Channel channel("channel");
	channel.SetData(data);

	// add signal sample in channel
	HistFactory::Sample signal_sample("signal_sample");
	signal_sample.SetHisto(Signal);

	RooStats::HistFactory::HistoSys shapeSys_S("shape_signal");
	shapeSys_S.SetHistoHigh(Signal_up);
	shapeSys_S.SetHistoLow(Signal_down);
	signal_sample.AddHistoSys(shapeSys_S);

	RooStats::HistFactory::NormFactor normS;
	normS.SetName("mu");
	normS.SetHigh(100); // maximum value it can take
	normS.SetLow(0); // minimum value it can take
	normS.SetVal(1); // nominal value
	signal_sample.AddNormFactor(normS);

    //  signal_sample.ActivateStatError();
	channel.AddSample(signal_sample);

	// add background sample in chennel
	HistFactory::Sample background_sample("background_sample");
	background_sample.SetHisto(Background1);

    //  background_sample.ActivateStatError();
	channel.AddSample(background_sample);

	// add channel in measurement
	meas.AddChannel(channel);

	HistFactory::HistoToWorkspaceFactoryFast h2w(meas);
	RooWorkspace* w = h2w.MakeCombinedModel(meas);
	w->Print("t");
	w->SetName("w");
	w->writeToFile("test_file.root");

data_hist is my (weighted) data. I want to fit, using Signal and Background1. I also add shapeSys_S to add systematic uncertainty on shape of Signal. My code to fit is

	TFile* f = TFile::Open("test_file.root");
	RooWorkspace* w = (RooWorkspace*)f->Get("w");
	w->Print();
	RooAbsData* data = w->data("obsData");

	ModelConfig* sbModel = (ModelConfig*)w->obj("ModelConfig");
	RooFitResult* fitres = sbModel->GetPdf()->fitTo(*data);

	RooSimultaneous* simPdf = (RooSimultaneous*)sbModel->GetPdf();

    TCanvas* cdata = new TCanvas("sPlot","sPlot demo", 700, 700);
    RooPlot* frame = w->var("obs_x_channel")->frame();
    data->plotOn(frame, RooFit::DataError(RooAbsData::SumW2));
    w->pdf("channel_model")->plotOn(frame);
    frame->Draw();

This code shows

I have several questions

  1. The above plot shows strange uncertainty. Because I use
	TH1F* data_hist = new TH1F("data_hist", "data_hist", 2, 0, 2);
	for (int i = 0; i < 10000; i++) data_hist->Fill(0.5,0.01);
	for (int i = 0; i < 1000; i++) data_hist->Fill(1.5, 0.1);

statistical uncertainty should be smaller than the above plot’s one. What should I do?

  1. I want to show signal and background components separately. Example plot is


    (source: Measurement of inclusive and differential cross sections in the $H \rightarrow ZZ^* \rightarrow 4\ell$ decay channel in $pp$ collisions at $\sqrt{s}$ = 13 TeV with the ATLAS detector)
    How can I draw this kind of plot?

  2. If I want to add statistical fluctuation of templates, is it OK to add

signal_sample.ActivateStatError();

and

background_sample.ActivateStatError();

in my first code?

Sorry for basic question. I cannot find detail example code in histfactory manual (https://cds.cern.ch/record/1456844/files/CERN-OPEN-2012-016.pdf). It only talks about how histfactory works. Also, there is no enough tutorial code in root (ROOT: HistFactory Tutorials).

Thank you

For 2: if all are histograms, you can add them to a THStack and draw with the option “nostack”; also add them to a TLegend. Instead of a THStack, you can draw them one by one on the same canvas with (for histograms) or without (for TGraphs) the option “same”, as shown in the TLegend doc above.

Sorry for the ambiguous question.

My question is how to draw histogram pdf, not histogram. For histogram pdf, there is not Draw member function.

Alternatively, I found components argument for plotOn function. Here is my fixed code:

  TFile* f = TFile::Open("test_file.root");
  RooWorkspace* w = (RooWorkspace*)f->Get("w");
  w->Print();
  RooAbsData* data = w->data("obsData");

  ModelConfig* sbModel = (ModelConfig*)w->obj("ModelConfig");
  RooFitResult* fitres = sbModel->GetPdf()->fitTo(*data);

  RooSimultaneous* simPdf = (RooSimultaneous*)sbModel->GetPdf();

  TCanvas* cdata = new TCanvas("sPlot", "sPlot demo", 700, 700);
  RooPlot* frame = w->var("obs_x_channel")->frame();
  data->plotOn(frame, RooFit::DataError(RooAbsData::SumW2));
  w->pdf("channel_model")->plotOn(frame, DrawOption("F"), FillColor(kRed));
  w->pdf("channel_model")->plotOn(frame, DrawOption("F"), FillColor(kBlue), Components("L_x_signal_sample_channel_overallSyst_x_HistSyst"));
  frame->Draw();

However, I found some problem.
For ROOT Version: 6.16/00, the above fixed code works fine:
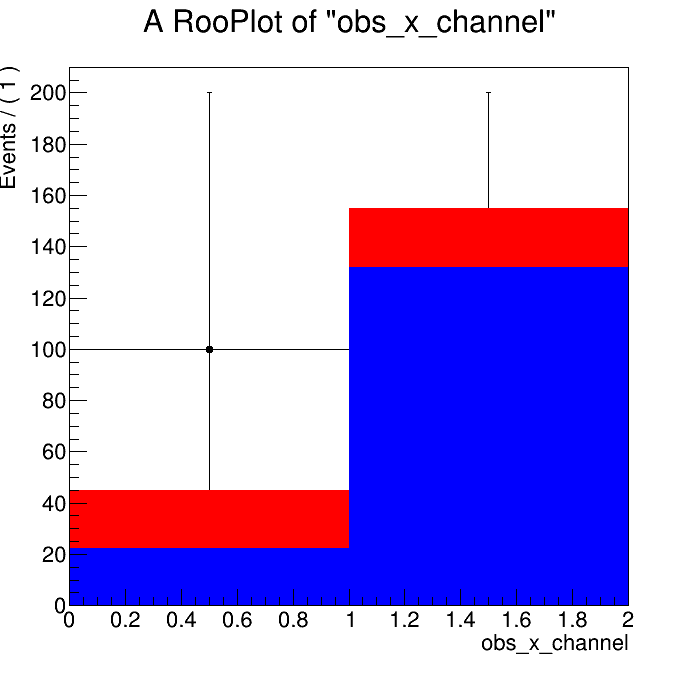

red histogram is Background1, and blue histogram is Signal. Though, when I run the same code at ROOT Version: 6.24/00, It shows

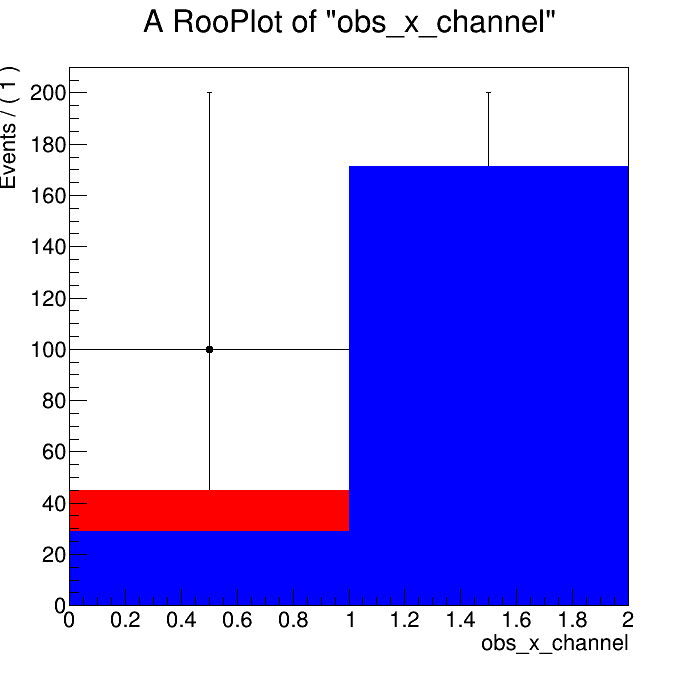
blue and red histograms are normalized by the number of data, respectively. I carefully guess it is a bug, because there was a similar bug at past (HistFactory plotting of components broken in ROOT 6.16/00).

This topic was automatically closed 14 days after the last reply. New replies are no longer allowed.