with the script attached below I’m using RDataFrame to quickly trim large input chains/trees. This worked nicely for me in the past with moderate sized inputs. However, I was now trying to trim a ~40 GB tree with 24 threads and got a bad alloc after using a little more than 13 GB memory.
I then tried to manually set the compression settings to the ones from the input file (206), resulting in an improved memory consumption (up to 5 GB), but a different error (running with IMT, 24 threads)
Fatal: !fStack.empty() && "Trying to pop a slot from an empty stack!" violated at line 33 of `/mnt/build/jenkins/workspace/build/projects/ROOT-HEAD/src/ROOT/HEAD/tree/dataframe/src/RSlotStack.cxx'
I hope that a sort of remote diagnosis for this is possible, since making a reproducer would be time consuming.
Edit The output tree has about 165 variables and is ~5 GB
Hi Marian,
the usual reason for large memory consuption with RDataFrame is that you are reading and writing out an input TTree with very bad clustering.
If you can confirm that running an event loop without a Snapshot does not show memory issues, then this is probably https://sft.its.cern.ch/jira/browse/ROOT-9587
Cheers,
Enrico
P.S. in any case, the large memory consuption is definitely not ROOT-9892
Hi Enrico,
I can confirm your assumption. I produced a histogram in the event loop and the memory usage stayed constant at ~2.4 GB.
Is there anything I can during production of the input data? I’m usually adding them from xrootd locations with hadd -ff.
Cheers,
Marian
about remote diagnosis: what is the invocation line of your trimming tool? I am interested in particular in the number of workers you set when you encounter the problem and the total number of logical cores of the machine you are running on.
Hi Danilo,
I’m setting the number of threads at runtime from an external config file in lines 92ff. It is the minimum of requested and available workers. For my test I used all available 24 logical cores, which is also the number you get from ROOT::GetImplicitMTPoolSize().
Cheers,
Marian
CPU(s):                24
On-line CPU(s) list:   0-23
Thread(s) per core:    2
Core(s) per socket:    6
Socket(s):             2
NUMA node(s):          4
Is there anything I can during production of the input data? I’m usually adding them from xrootd locations with hadd -ff .
You can try with hadd -ff -O. If that doesn’t work @amadio might have a suggestion. It would also be interesting to see what tree->Print("clusters") says when tree is that hadd-ed input tree that causes problems with Snapshot.
Sorry for mixing posts with @Danilo but we are really dealing with two independent issues.
Printing the “bad” tree gives the output pasted below. In the meantime I’m re-hadding part of the files, trying different flags and update the post as soon as i see something interesting.
To follow up, I tried to hadd smaller files and saw nothing suspicious. Since then i’m adding larger files
-rw-r--r-- 1 mstahl lhcb  18G Jan  7 16:43 test_ff.root
-rw-r--r-- 1 mstahl lhcb  26G Jan  7 18:50 test_fk404O.root
-rw-r--r-- 1 mstahl lhcb 4.1G Jan  7 19:47 test_ffO.root
The last one will probably take a few more hours. As the names indicate, the first one was produced with the -ff flag, the second with -fk404 -O and the third with -ff -O
During trimming i didn’t see a large difference in memory usage. However, IMT had larger impact on the -ff file (faster in real time, but slower in CP time)
Real time 0:02:06, CP time 2238.090 vs. Real time 0:03:15, CP time 912.820
The output of both jobs looks the same up to a few bytes
******************************************************************************
*Tree    :DsPiTuple : DsPiTuple                                              *
*Entries :  2323684 : Total =      3285018122 bytes  File  Size = 2262241595 * <- ff
*Entries :  2323684 : Total =      3284986667 bytes  File  Size = 2262200386 * <- fk404 O
*        :          : Tree compression factor =   1.45                       *
******************************************************************************
Cluster Range #  Entry Start      Last Entry        Size
0                0                2323683          -30000000
@eguiraud Priot to v6.14/06 due to a deficiency the ‘estimate’ was to have a series of cluster of size 1 !! In v6.14/06 and later the cluster size estimate is fTree->GetEntries() * cacheSize / zipBytes, i.e. the average number of entries that fits in the current TTreeCache size.
Uhm I see thanks. Unfortunately this does not solve the mystery: Marian is on v6.17 and he sees Snapshot hogging memory, which should only happen when the TBufferMerger queue is filled with many buffers (which have a 10 MB minimum size even if they only contain a few KB of useful information) so my best guess is still that the clustering of the input file is such that each cluster contains much much less than 10 MB worth of data.
@marian, do you see a large unexplained memory usage if you just do RDataFrame(treename, filename).Snapshot("t", "outfile.root");? If yes, I’m afraid we’ll need one of those files: would it be an option to share them?
Yes I still see large memory usage. I now attempted to run with an updated version (see attachment) of my script, which allows calling Snapshot with an empty string as third argument and just copies the tree. On the input mentioned in the initial post i get many
Error in <ROOT::Experimental::TBufferMergerFile::mkdir>: An object with name B2DsPiDTTuple exists already
messages.
You mentioned that i’m using ROOT 6.17. This is only true for the trimming script i’m afraid. The input files have been created some 2 years ago. Could this be the issue?
EDIT
When running just the snapshot from the interactive shell I see a peak memory consumption of 13 GB, without errors from TBufferMergerFile but another
Fatal: !fStack.empty() && "Trying to pop a slot from an empty stack!" violated at line 33 of `/mnt/build/jenkins/workspace/build/projects/ROOT-HEAD/src/ROOT/HEAD/tree/dataframe/src/RSlotStack.cxx'
another EDIT
In the edit above I was running with the “wrong” input file (in LHCb we usually divide the data by magnet polarity and I got the wrong one). This accident could be interesting, since this “wrong” file only has one cluster
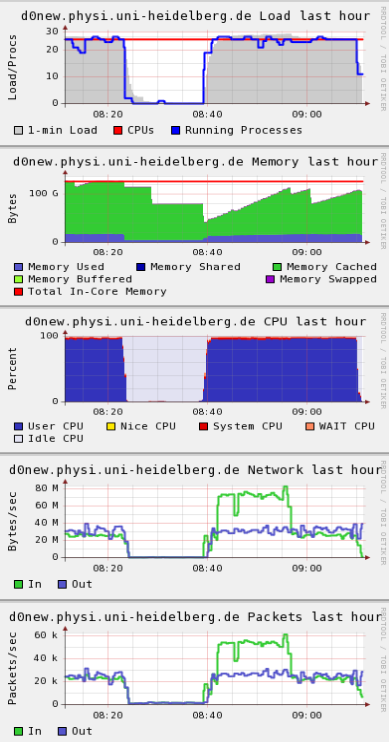
When running on the large input tree with 405 clusters, I see a memory consumption of up to 13 GB as well, but this time it completed successfully. For what it’s worth i’m also attaching some monitoring plots showing processing of the two files (1 cluster first, then the one with 405 clusters)
Cluster Range #  Entry Start      Last Entry        Size
0                0                19521682         15948
Hi, just to clarify, the output of Print("clusters") can be a bit misleading at first: this line indicates you have many clusters, all of the same size (15948 entries).
For the "Trying to pop a slot from an empty stack!" error, please refer to the corresponding jira ticket (it’s being actively worked on).
For the large memory usage, there is one last thing you can try to confirm that the cause is the jira ticket I shared above (i.e. bad clustering):
auto it = tree->GetClusterIterator(0);
auto clusterStart = 0ull;
auto clusterEnd = 0ull;
const auto nEntries = tree->GetEntries();
while (clusterEnd != nEntries)
{
   clusterStart = clusterEnd;
   clusterEnd = it.Next()
   std::cout << clusterEnd - clusterStart << std::endl;
}
This should print the sizes of the clusters as seen by RDataFrame.
If there are a lot of small values, that’s a problem.
If this test does not show irregularities, we will need a file to diagnose why Snapshot hogs that much RAM.
Hi Enrico,
I don’t see many small values. Even the one with many clusters of different size doesn’t look too bad. I will let you know where the file is.
Cheers,
Marian