Dear Experts,
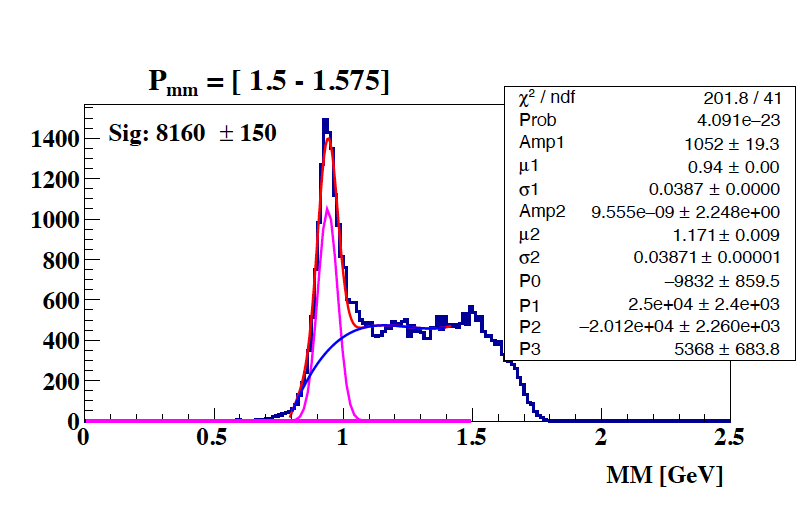
I have histograms that I would like to get the yields from the gaussian signal. However, I couldn’t find the best function that can describe my background. I have tried Gaussian+Poly and 2 Gaussian+poly. I am wondering if I can find any suggestion from you about the function that you think can work well to fit my background or if there is any way in root that I use to subtract the background. I have attached my histogram to see the shape of the background.
Thanks in-advance,
Suppose you take a polynomial of 20th degree: it might fit your data really well. But then it will also git much of the signal well, or at least have arbitrary behavior in that region if you exclude it from the fit range.
I say that to demonstrate that without a physics model of what is creating / shaping the background you might be able to find a great fit function but it will not allow you to reason about the signal region.
Maybe I’m misunderstanding the signal / background case here, if so please explain why you think you can do without a background model.
It is possible that your “signal” is not a nice symmetric gaussian, e.g.:
Wikipedia → Generalized normal distribution → Asymmetric version
Wikipedia → Skew normal distribution
Wikipedia → Gaussian function → Higher-order Gaussian or super-Gaussian function
Hello @lamya86 !
You could try using convolution of uniform and Gaussian distribution.
I can share this ready snippet
TF1 *bkg = new TF1("bkg", [](double * x, double * p){
    return p[0] * 0.5 / (p[2] - p[1]) *
           (std::erf((p[2] - x[0]) / p[3] / sqrt(2)) -
            std::erf((p[1] - x[0]) / p[3] / sqrt(2)));
}, 0.0, 2.5, 4);
bkg->SetParNames("N", "a", "b", "#sigma");
Simple “erfc” based background examples (the peak is a symmetric gaussian):
Thanks @Wile_E_Coyote, @Axel, and @Ako_b for your suggestions. I have tried to use the Crystal ball function which I think is similar to “erfc” that you mentioned. Let me explain the main issues that I faced. I actually have 36 bins each bin has 2 histograms (expected and detected peaks). I have attached my attempt at using the Crystal ball function for all 25 bins. On each page, you will see 2 histograms (top: expected peak, bottom: detected peak). If I assume the shape of the peak has exponential tails, I should have the same tail in expected peaks but I haven’t seen that in some bins (as you can see on page 19, 22). Also, the exponential tails should be the same at different bins but at large bins, the crystal ball turns to a Gaussian function and they have a small tail (as you see on pages 23-25).
The shape of the peak should be same at all bins. I really struggle of finding a good fitting that I can use it for all different bins. I appreciate any help or suggestion.
CrystalbllPol3.pdf (3.0 MB)
I guess you need to talk to people familiar with your data (e.g., your colleagues and/or supervisor).