Please read tips for efficient and successful posting and posting code
_ROOT Version: 6.26/11
_Platform: Scientific Linux 6.7
Compiler: Not Provided
Hi experts,
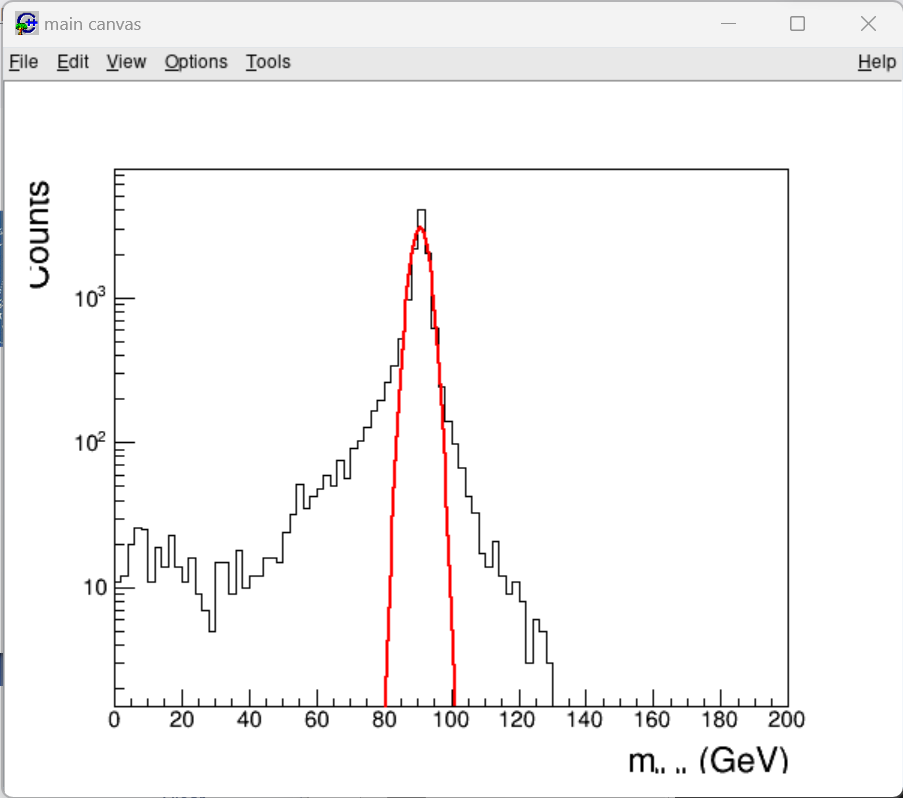
I have a histogram in a root file, and I want to plot it; the plot works fine, but when I set the titles on x and y axes these are cut by the canvas, as you can see in the image below.
I tried to reduce the pad1 dimensions inside the canvas, or to change both canvas and pad margins, but this doesn’t seem to affect the titles; I tried also to reduce the title offset, but that’s not the solution I want to go for.
Does anyone have suggestions?
#include<string>

void grafici2(){

  //VARIABLES CONTROLLING PARAMETERS OF PLOT

  int numero_grafici = 1;

  bool gridy = false;
  bool gridx = false;
  bool logy = true;
  bool logx = false;
  bool stat = false;
  double xLabelSize = 0.055;
  double yLabelSize = 0.055;
  double xLabelOffset;    //0.9
  double yLabelOffset;    //0.3

  string title;
  string titleX = " m_{#mu #mu} (GeV)";
  string titleY = " Counts ";
  //cout << title << endl;

//EXTRACTS HISTOGRAM FROM FILE

  string histogram1 = "DiMuonMassFit1R";
  string function1 = "MuonMassFit1";
  string nome_file1 = "HistoOutMcDY_1.root";
  string nome_file2 = "HistoOutMcDY_2.root";

  TList *FileList = new TList();
  FileList->Add( TFile::Open(nome_file1.c_str(), "read") );
  FileList->Add( TFile::Open(nome_file2.c_str(), "read") );

  // if we cannot open the file, print an error message and return immediately
  for(TObject *obj: *FileList){
    TFile *f1 = (TFile*)obj;
    if (f1->IsOpen() == kFALSE ) {
      string file_error = obj->GetName();
      printf("Error: cannot open %s", file_error.c_str());
      return;
    }
  }
  //FileList->Print();

  TH1F *Histo;
  TH1 *FitFunction;
  for(TObject *obj: *FileList){
    TFile *f1 = (TFile*)obj;
    TIter keyList(f1->GetListOfKeys());
    TKey *key;
    while ((key = (TKey*)keyList())) {
      string keyname = key->GetName();
      //cout << keyname << endl;
      if( keyname == histogram1 ){
        //cout << "trovato!" << endl;
        Histo = (TH1F*)f1->Get(histogram1.c_str());
      }
      if( keyname == function1 ){
        FitFunction = (TH1*)f1->Get("MuonMassFit1");
      }
    }
    //cout << endl;
    //cout << "fine file" << endl << endl;
  }

//GRAPHIC - IMPORTANT PART

  TCanvas *c1 = new TCanvas("c1", "main canvas",0,0,600,500);
  TPad *pad1 = new TPad("pad1","pad1",0.03,0.03,0.97,0.97);

  if(gridy == true){
    pad1->SetGridy();
  }
  if(gridx == true){
    pad1->SetGridx();
  }
  if(logx == true){
    pad1->SetLogx();
  }
  if(logy == true){
    pad1->SetLogy();
  }
  if(stat == false){
    gStyle->SetOptStat(0);
  }
  if(xLabelOffset!=0){
    Histo->GetXaxis()->SetTitleOffset(xLabelOffset);
  }
  if(yLabelOffset!=0){
    Histo->GetYaxis()->SetTitleOffset(yLabelOffset);
  }

  Histo->SetTitle( title.c_str() );
  Histo->GetXaxis()->SetTitleSize(xLabelSize);
  Histo->GetXaxis()->SetTitle(titleX.c_str());
  Histo->GetYaxis()->SetTitleSize(xLabelSize);
  Histo->GetYaxis()->SetTitle(titleY.c_str());

  Histo->SetLineColor(1);
  FitFunction->SetLineColor(2);

  pad1->Modified();
  pad1->Draw();
  pad1->cd();

  Histo->Draw();
  FitFunction->Draw("same");
  c1->Print("prova.pdf");
}