Hello everyone.
I’m sorry I have to ask this, as it may be a very simple question.
I have a histogram h1, for example, with variable bin size with low edges
(8,15,20,25,30,40,50)
with the last bin in the range 40-50. I want to plot this histogram but with bin labels, each of them indicating the bin range. For example, in bin with range 40-50, I want a label between the ticks that reads 40-50.
I can manage to do that, but the problem is that the ticks don’t appear at the low edges of the bins, instead, I get them each 10 GeV. Here in the image I set bin labels to be “bin”, but that’s not the problem
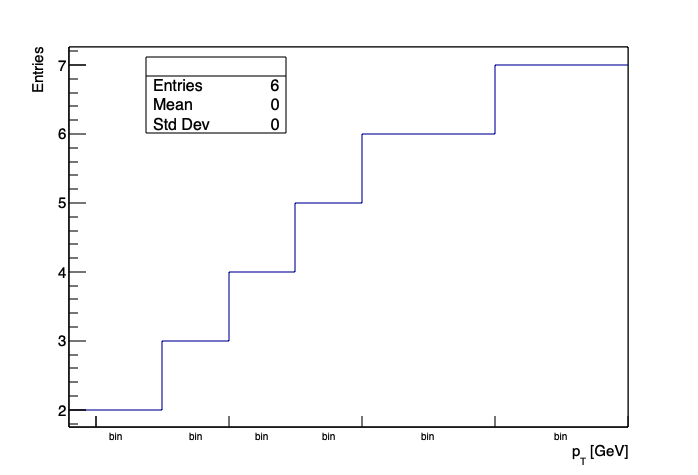
Here is the simple code I used to plot this histogram
double lowedges[7] = {8,15,20,25,30,40,50};
TH1F * h1 = new TH1F("", "", 6, lowedges);
// Fill Histogram
for (int i = 1; i<= h1->GetNbinsX(); i++)
{
      h1 -> SetBinContent(i, 1+i);
}
// Change bin labels
for (int i = 1; i<= h1->GetNbinsX(); i++)
{
      h1 -> GetXaxis() -> SetBinLabel(i, "bin");
}
h1 -> Draw("hist");
So, how can I modify the ticks position to be at the edges of the bins?
Any help is very appreciated!
Thank you very much,
Francisco
 .
.