_I am compiling several data points with Tgraph at x axis and y axis but meanwhile getting points at y axis with pow(10,-76). unable to set with y axis range command also. And also not fitted in log axis form. Here attaching Tgraph script and attaching png file
fluxbon.c (1.0 KB) fluxbon.c (1.0 KB) of plot.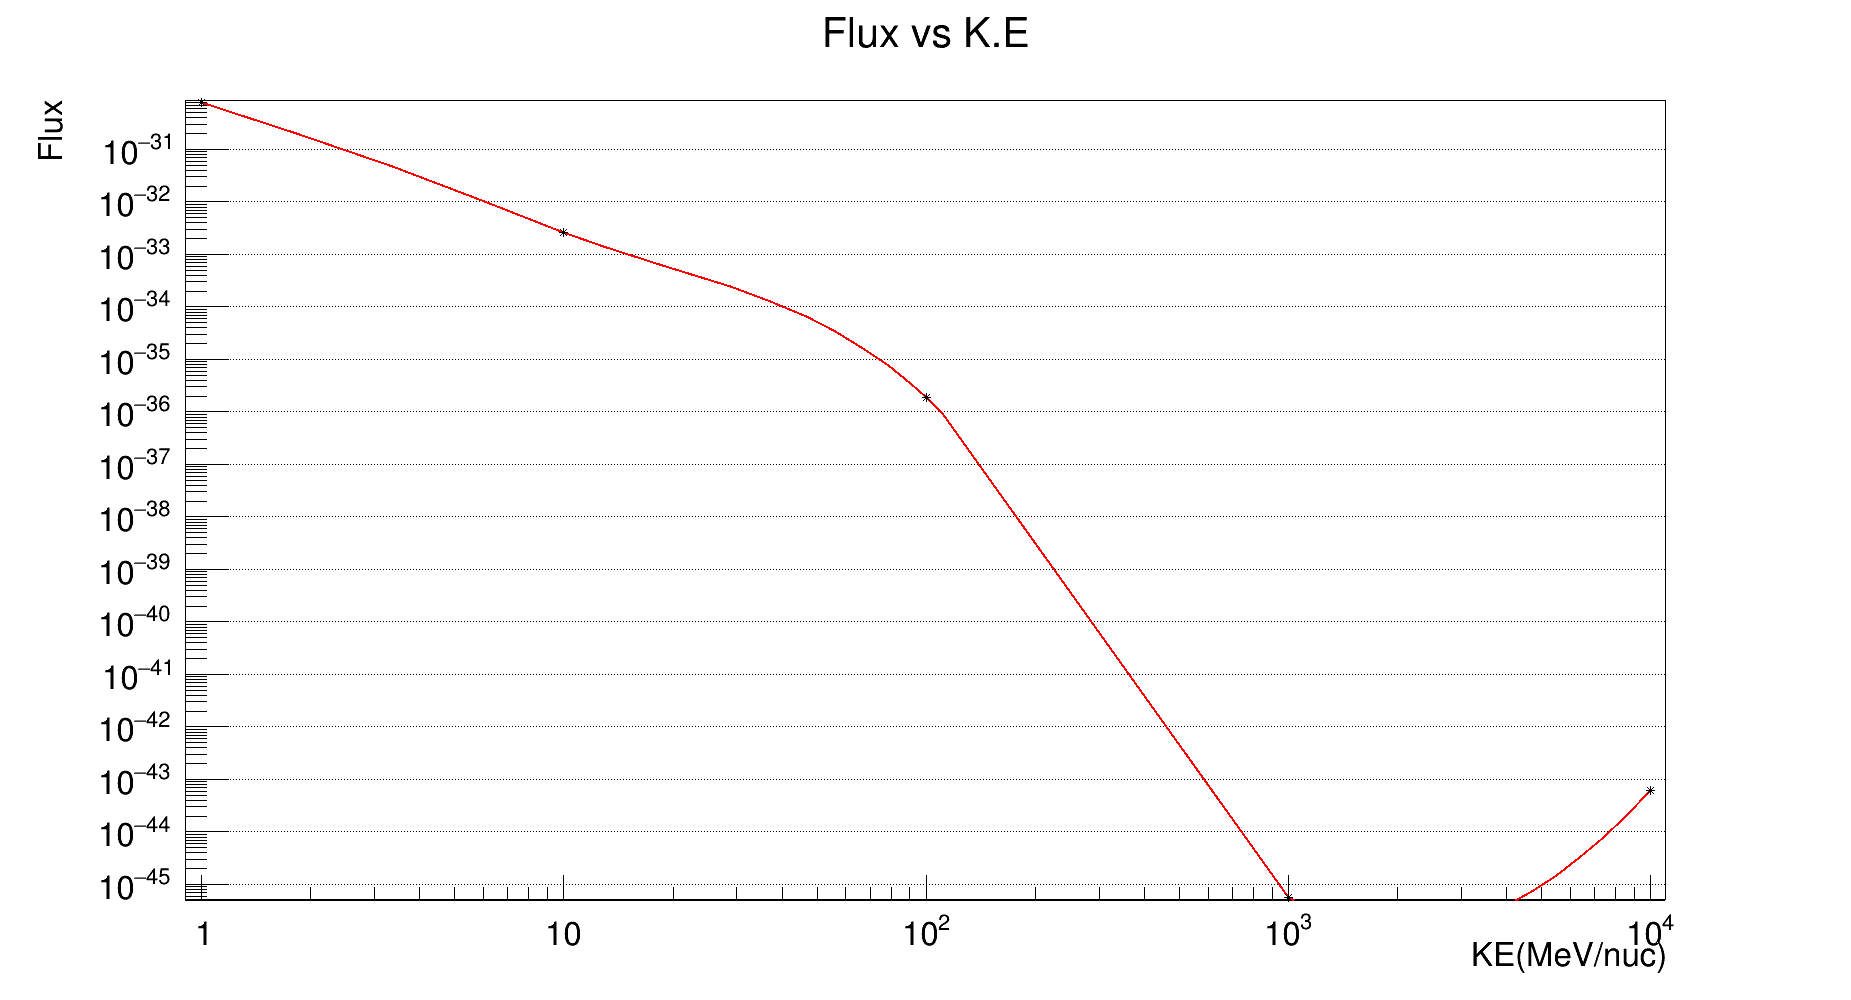
Please read tips for efficient and successful posting and posting code
ROOT Version: Not Provided
Platform: Not Provided
Compiler: Not Provided