Hi I am having some trouble setting the axis range on my TGraph. Normally when I input the data I want plotted through a google sheet it automatically sets the axis but that wasn’t working so I used arrays. Is there a way to get it to automatically set the range correctly? Here is was I did:
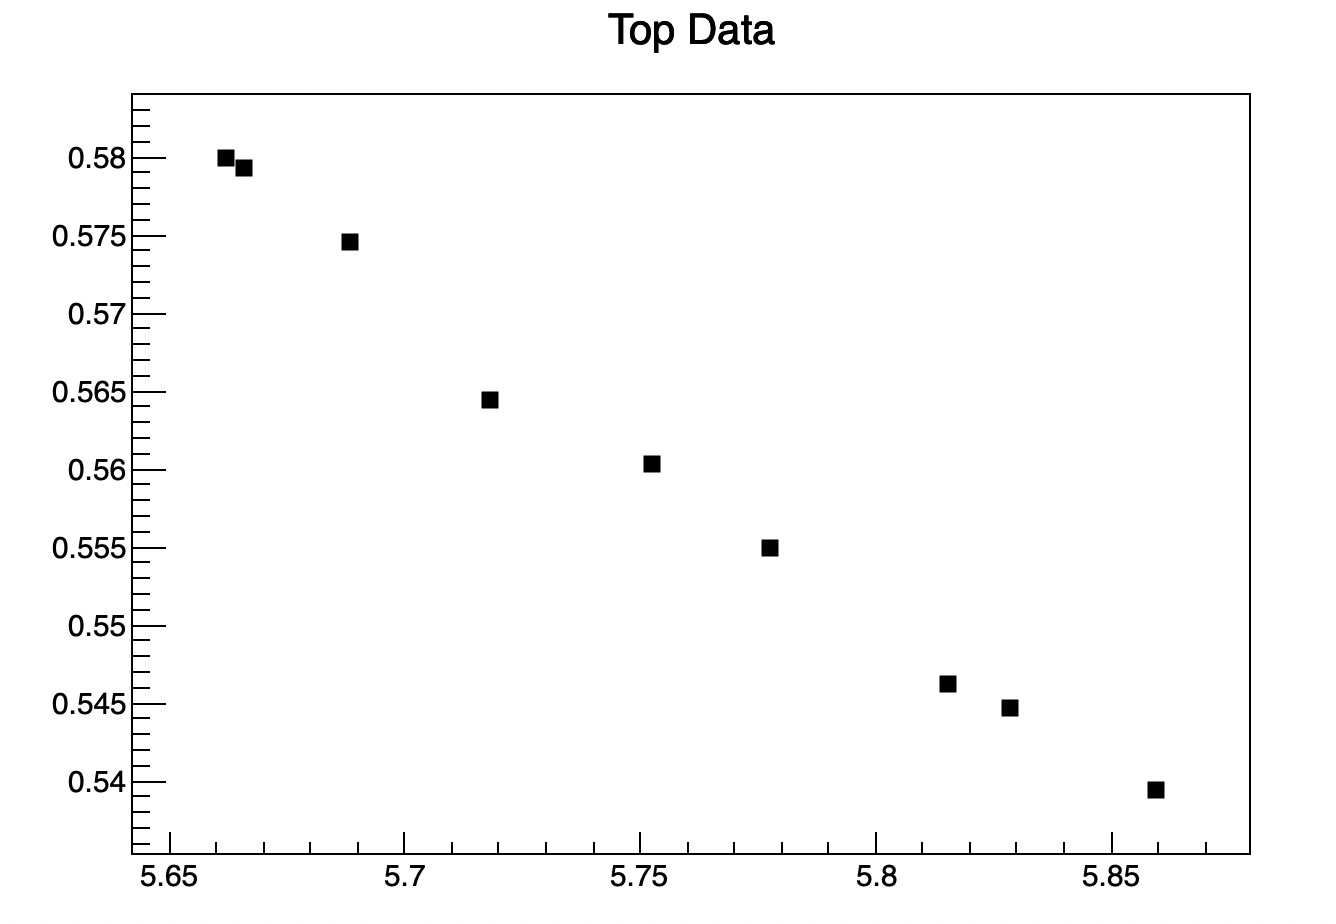
  double rw[10] = {5.6661, 5.7183, 5.7527, 5.662, 5.8153, 5.8596, 5.6885, 5.7776, 5.8284};
  double a[10] = {0.5793, 0.5645, 0.5603, 0.58, 0.5463, 0.5394, 0.5746, 0.5549,0.5447};
  g = new TGraph(10, rw, a);
  g->GetXaxis()->SetRange(5.6,5.9);
  g->SetMarkerStyle(21);
  g->SetLineColor(kRed);
  g->SetTitle("Top Data");
  gStyle->SetOptFit(1);
  g->Draw("AP");