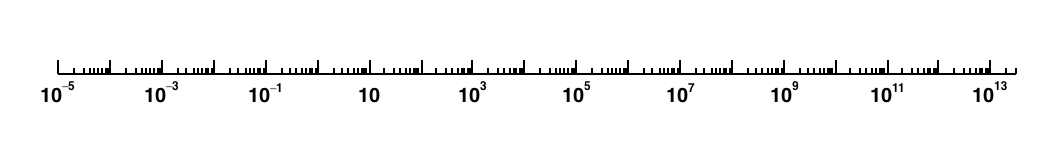
The number of divisions is managed a bit differently in case of log. It is more the number of labels drawn on the decades.They are distributed along the axis but all the decades are drawn. The exact labelling you are asking is not possible just playing with the number of divisions. The only way I can think of would be to draw the axis showing the labels you need and then remove the labels you do not want. The labels you need are shown when the number of divisions is at least equal to 15. The following macro does what you want:
{
   TCanvas* c1 = new TCanvas("c1","",10,10,600,300);
   c1->Range(-10,-1,10,1);

   TGaxis *a1 = new TGaxis(-8,0,8,0,1e-5,3e13,15,"G");
   a1->ChangeLabel(2,-1,0.);
   a1->ChangeLabel(3,-1,0.);
   a1->ChangeLabel(4,-1,0.);
   a1->ChangeLabel(5,-1,0.);
   a1->ChangeLabel(7,-1,0.);
   a1->ChangeLabel(8,-1,0.);
   a1->ChangeLabel(9,-1,0.);
   a1->ChangeLabel(10,-1,0.);
   a1->ChangeLabel(12,-1,0.);
   a1->ChangeLabel(13,-1,0.);
   a1->ChangeLabel(14,-1,0.);
   a1->ChangeLabel(15,-1,0.);
   a1->ChangeLabel(17,-1,0.);
   a1->ChangeLabel(18,-1,0.);
   a1->ChangeLabel(19,-1,0.);
   a1->Draw();
}