Dear ROOT friends,
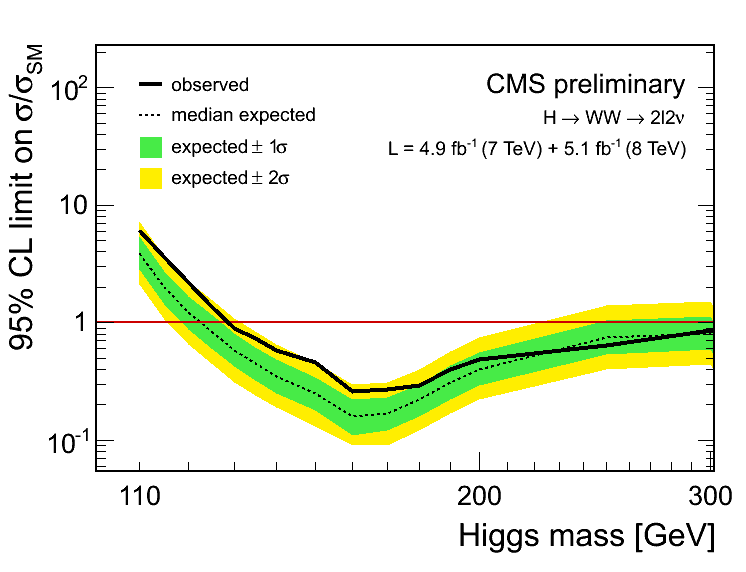
Recently I had to make some plots in logx scale, normally in the range between 100 and 300, or between 100 and 600. The default behavior of ROOT (as far as I can tell) in such range and scale is to not draw any label (or just one), and a minimal number of ticks – two or three. I have copied below the code that I have written to overcome this logx problem, and I have a couple of questions:
-
Is this issue/feature known? If so, can somebody point me to the right commands?
-
If this issue isn’t known, or if it isn’t fixed yet, can somebody help me improving
the code below? For example, the tick sizes are not automatic.
Finally, I hope you can see in this image how my plots looks like by using the code below.
Thanks and best regards,
Jonatan
Float_t mhmin = 100;
Float_t mhmax = 300;
Float_t uxmin = canvas->GetUxmin();
Float_t uxmax = canvas->GetUxmax();
Float_t uymin = canvas->GetUymin();
if (canvas->GetLogx()) {
ExpBand95->GetXaxis()->SetNdivisions(0);

TLine tick;

tick.SetLineWidth(1);
tick.SetLineColor(1);

for (Int_t i=100; i<=600; i+=10) {

  if (i < mhmin || i > mhmax) continue;

  Float_t xx = i;

  if (canvas->GetLogy())
tick.DrawLine(xx, pow(10,uymin), xx, pow(10,uymin) + (i%100 == 0 ? 0.025 : 0.01));
  else
tick.DrawLine(xx, uymin, xx, uymin + (i%100 == 0 ? 0.75 : 0.3));
}


// TLatex
//--------------------------------------------------------------------------
Float_t ylatex = (canvas->GetLogy()) ? pow(10,uymin) - 0.02 : uymin - 0.75;

Float_t xbins[6] = {100, 200, 300, 400, 500, 600};

while (mhmin > xbins[0]) xbins[0] += 10;

for (Int_t i=0; i<6; i++) {

  if (xbins[i] < mhmin || xbins[i] > mhmax) continue;

  TLatex* latex = new TLatex(xbins[i], ylatex, Form("%.0f", xbins[i]));

  latex->SetTextAlign(  22);
  latex->SetTextFont (  42);
  latex->SetTextSize (0.05);

  latex->Draw("same");
}
 and now I can choose: